
Fibonacci retracement is an important technical analysis tool used by most proficient stock market traders around the world. This number theory-based metric helps traders in analysing the different buy and sell points of selected stocks. While the use of this technical tool is restricted due to lack of awareness, it presents a scope for further use as Indian stock markets are seeing a large number of new investor entrants in recent years.
What is Fibonacci Retracement?
Introduction of the Fibonacci concept
The Fibonacci concept was first introduced by an Italian Mathematician named Fibonacci (also known by the names Leonardo Bonacci or Leonardo of Pisa). Fibonacci was the first person to observe a sequence and its coincidences in what is today referred as Fibonacci Retracement. This concept was introduced with an intent to address the problem of better understanding the population growth of rabbits. Today, it is one of the most sought after concepts in the fields of math and trading.
Understanding Fibonacci retracements
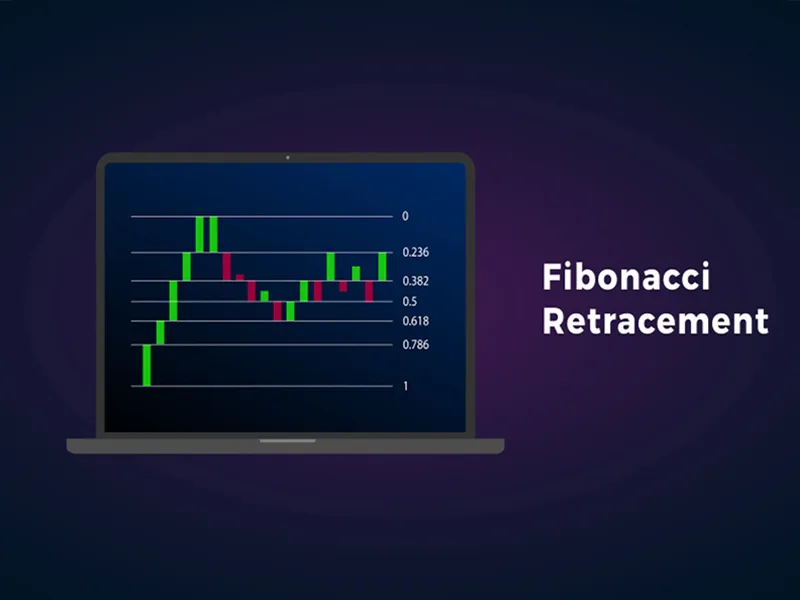
Fibonacci retracements are based on:
- Designated Fibonacci numbers
- Related Golden Ratio
In mathematical terms, Fibonacci numbers are also referred to as Fibonacci series. This is a sequence of numbers whose value is derived from the sum of the previous two numbers. A common example to understand a Fibonacci series is:
0, 1, 1, 2, 3, 5, 8, 13, 21, 34, 55, 89, 144, 233, 377, 610, 987…
What is interesting about the Fibonacci series?
- Each number in the series is the sum of the 2 numbers that are stated immediately prior to it. The sequence continues to infinity.
- If we divide any number from the series with its preceding value, the ratio in almost all cases will be 1.618. For example, 610/377=1.618, 144/89=1.618.
This ratio of 1.618 is also called the ‘Golden Ratio’. Some interesting points about this ratio are:
- It is found in various aspects of nature.
- Galaxy formations, ideal proportions of a human face in art, DNA molecule construction, etc are some examples.
- If mentioned as a percentage, the ratio comes to 61.8%.
How to use Fibonacci while trading stocks?
Fibonacci retracement is one of the many technical analysis tools that can help in identifying a stock’s ‘call’ price levels. It can be used in both inter-day and intra-day trading of stocks.
Fibonacci retracement can be noticed whenever there is a noticeable upward or a downward trend in a stock’s price. This analytical tool tells us that if a stock’s price is on a high, it may first retrace back before moving up again on the price charts.
Let us understand this with an example.
Suppose a stock is currently selling at Rs.500. It’s price is seen to be moving up to touch Rs. 1000 or may be higher. As per Fibonacci method, there is a high probability that the stock’s price will first retrace back to Rs. 700 to experience a negative curve before it reaches price highs of Rs. 1,200 and higher.
Implementing Fibonacci retracement in stock buy/sell decisions
Considering market volatilities, before settling on a certain price level of a stock, traders must consider values of 23.6%, 38.2% or 61.8%. This method tells us that it is better to wait off before buying or selling until a stock’s price settles to stable levels by correcting itself.
Although there is no set formula of Fibonacci retracement, traders can pick two points between a stock price band’s highs and lows. They can then plot the lines at percentages of Fibonacci retracement numbers on the graph.
Here’s how to go about it:
A trader can pick a stock with a price ranging between Rs. 100 – 150 on the chosen trading day. Using these two price points, one can calculate the retracement indicator.
- If the share price retraces to 38.2%, it will drop to = 150 – 38% of 50 = 131
- If the share price retraces to 61%, it will drop to = 150 – 61 % of 50 = 119
What are the drawbacks of using Fibonacci Retracement in real trading scenarios?
Fibonacci retracement indicators have many limitations when it comes to real-life decision-making on stock buying and selling:
- Fibonacci retracement only provides indication on static stock price levels. One cannot be sure about a certain stock’s price exceeding or coming below-predicted levels.
- Various factors go into estimating and predicting a stock’s price. While using Fibonacci retracement, all the other factors have to be considered to determine future price levels.
- A stock’s support and resistance levels are not dependent on the Fibonacci retracement values. Therefore, these should not be the only determinants used by technical traders. A seasoned trader will take into account other factors too before making a decision.
Conclusion
Using Fibonacci retracement exclusively for determining trade entry and exit is not ideal. Both fundamental and technical determinants must be considered for the same. Traders can look at the candlesticks formation along the retracement levels, price actions near these levels, support and resistances surrounding it, volume at such retracement levels, and overall fundamental construct All these put together can help in better decision making when it comes to trading stocks at the right levels.
FAQs
Technical analysis is crucial in stock trading since it indicates when to enter or exit a stock trade
and provides price information on selected stocks. It is used by traders to ensure profit maximisation and risk minimisation.
A stock market price chart reflects a sequence of stock prices plotted across a specific time period. Any security with price information across a time range can be used to set up technical charts. Some of the common technical charts include open & high, low close chart, candlestick chart, line chart, and point & figure chart.
Support and resistance are specific price points on a technical chart. These points usually attract most buying or selling activity. The support price of a stock is a price at which there are more buyers than sellers. Resistance price is a price at which there are more sellers than buyers
Technical analysis is usually based on a specific theory. If the statistics derived out of this analysis give mixed signals, it results in an indecision. At times, one indicator may give a buy signal while other technical indicators may show a sell signal.
New investors in the stock market can learn about technical analysis by reading up books on basics of technical analysis. The online space is also flooded with a lot of material on technical analysis. By starting to trade in certain low-cost stocks using this analysis, one can gain experience and continue learning in-depth.


