

|
||||||||||||||||||||||||||
| ||||||||||||||||||||||||||
Technical Overview – Nifty 50 | ||||||||||||||||||||||||||
| ||||||||||||||||||||||||||
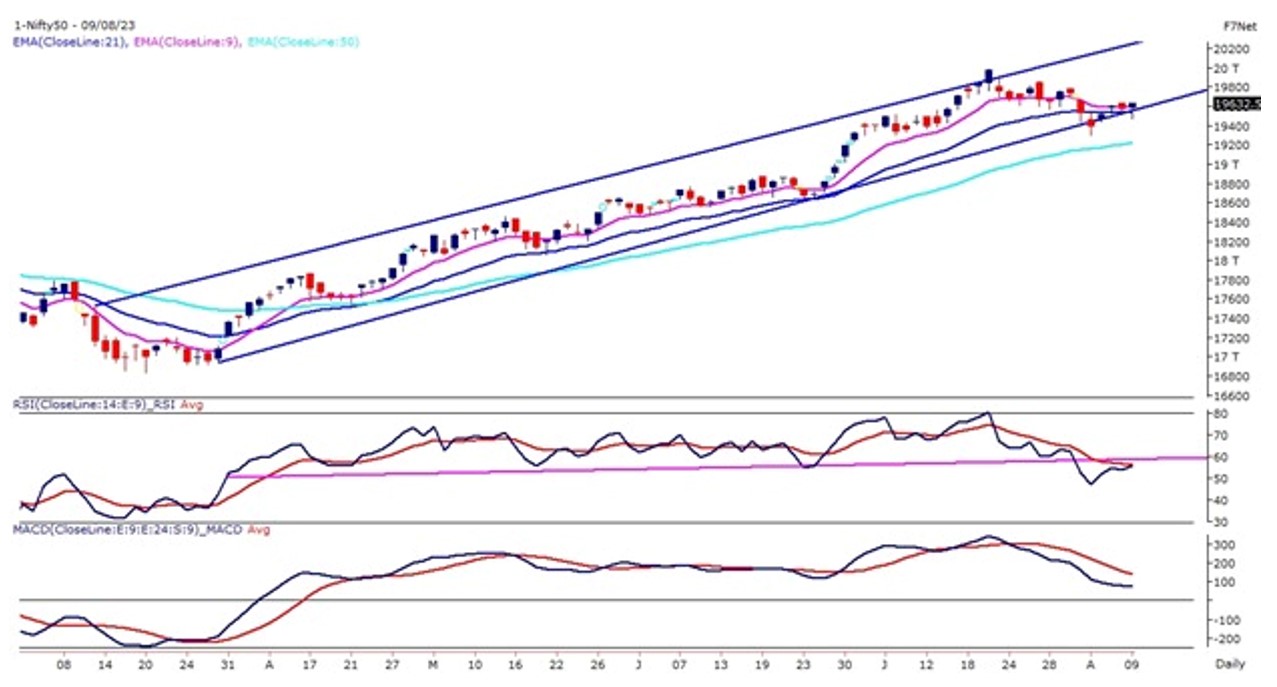
It was a complete turnaround from the Benchmark index after trading in a bearish bias in the first half of the trade. Index on the intraday chart has formed a V-shape reversal rally where prices moved higher rapidly after finding support near 19,500 levels. The Nifty50 on the daily chart has formed a bullish hammer candle stick pattern near the lower band of the rising channel pattern. The prices from the last three trading sessions witnessed a close near the 19,600 mark. Call Writers Were Killed in Action today as massive unwinding was seen in Short Calls, and OI reduced from 7.8Lk to only 1.5 Lk Technical Breakout above 19580 was seen, leading to further aggressive positions from PUT Sellers. A break below 19450 would add bearishness & take the index lower near 19300 levels while on the higher side index needs to take out 19700 levels which prove to be a strong resistance zone. | ||||||||||||||||||||||||||
Technical Overview – Bank Nifty | ||||||||||||||||||||||||||
| ||||||||||||||||||||||||||
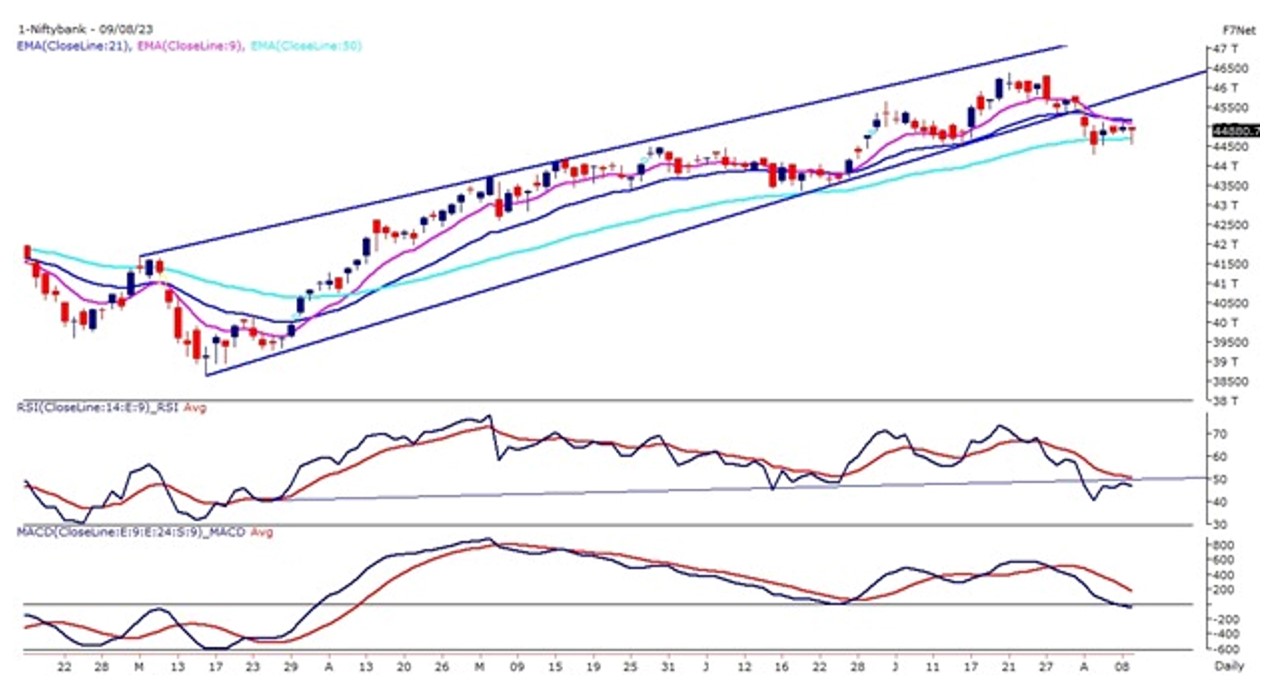
It was a complete turnaround from the Banking index after trading in a bearish bias in the first half of the trade. Index on the intraday chart has formed a V-shape reversal rally where prices moved higher rapidly after finding support near 44,600 levels. The Bank Nifty on the daily chart has formed a bullish hammer candle stick pattern near the 50-day exponential moving average. The prices from the last three trading sessions witnessed a close within the range of the 44,800 – 45,000 mark. Maximum Call Open Interest Build Up witnessed in 45000-46000 Calls & on the Put Side Maximum Open Interest is being witnessed in 44500-44700 levels. The PCR ratio holds at 0.71. The momentum oscillator RSI (14) has drifted below its trend line support which is placed at 50 levels and closed below the same on the daily time frame. The immediate support for the Bank Nifty stands at 44,650 – 44,400 levels and the index is likely to face resistance near 45,200 – 45,400 levels. | ||||||||||||||||||||||||||
Indian markets:
| ||||||||||||||||||||||||||
Global Markets
| ||||||||||||||||||||||||||
Stocks in Spotlight
| ||||||||||||||||||||||||||
News from the IPO world🌐
| ||||||||||||||||||||||||||
|
Day Leader Board
| ||||||||||||||||||||||||||
Sectoral Performance
| ||||||||||||||||||||||||||
Advance Decline Ratio
| ||||||||||||||||||||||||||
Numbers to track
| ||||||||||||||||||||||||||
|
Please visit www.fisdom.com for a standard disclaimer. |
||||||||||||||||||||||||||