
Valuable Insights From History
Disciplined investors triumph as the ultimate winners
History
- Consistent Market Performance: Regardless of election outcomes, the market has consistently delivered returns exceeding 12% over the subsequent three to five years, highlighting its resilience and growth potential. The highest returns were observed between 2004 and 2009, when neither the BJP nor Congress held a majority.
- Institutional Flows: Historical data shows that Foreign Portfolio Investment (FPI) inflows tend to exhibit a positive response in the period leading up to and following general elections.
- MF Impact: Long-term SIP investors reaped the rewards due to their unwavering commitment. Even the underperforming funds yielded returns exceeding 9% in most cases. The leading performer within the core equities segment achieved returns surpassing 20%.
Learnings:
- Macro Indicators Prevail: Domestic and global macroeconomic indicators exert a more substantial and enduring influence on the markets than election results alone. Factors like economic fundamentals, corporate performance, global events, monetary policies, and geopolitics play pivotal roles.
- Balancing Short-Term Volatility: While elections can introduce short-term volatility and sentiment fluctuations, it’s essential to focus on the bigger picture, emphasizing a resilient, well-rounded investment approach.
Lok Sabha Election Details & Results
Opinion polls suggest a comfortable victory for the BJP
History: The majority was only observed in the last two general elections starting from 1996.
| Year | Constituencies | Single largest party | Seats contested | Seats won | % share in valid votes |
| Numbers | at the national level | ||||
| Numbers | Numbers | Per cent | |||
| 1991 | 543 | INC | 500 | 244 | 36.4 |
| 1996 | 543 | BJP | 471 | 161 | 20.3 |
| 1998 | 543 | BJP | 388 | 182 | 25.6 |
| 1999 | 543 | BJP | 339 | 182 | 23.8 |
| 2004 | 543 | INC | 417 | 145 | 26.5 |
| 2009 | 543 | INC | 440 | 206 | 28.6 |
| 2014 | 543 | BJP | 428 | 282 | 31.3 |
| 2019 | 543 | BJP | 436 | 303 | 37.7 |
INC: Indian National Congress, BJP: Bhartiya Janata Party, BLD: Bhartiya Lok Dal
Source: CMIE
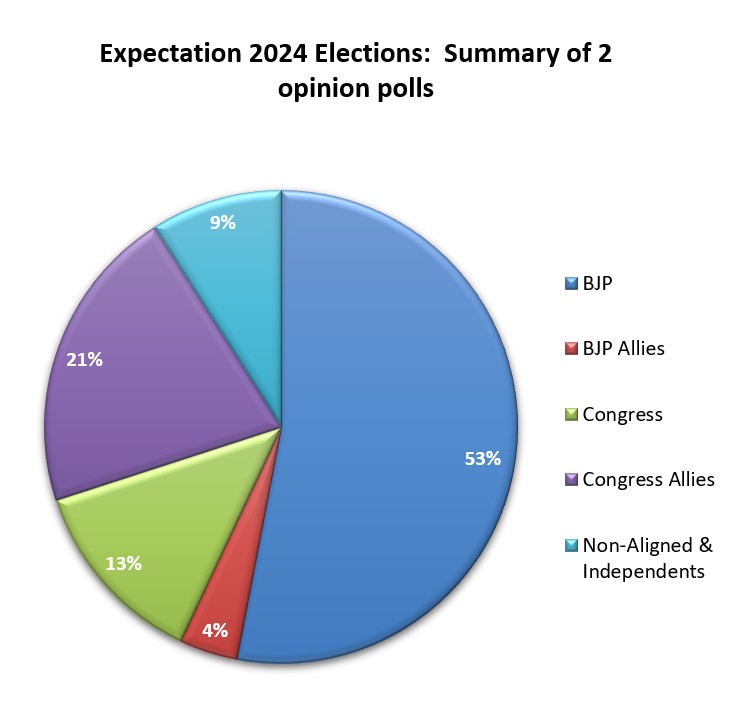
Source: India Today-CVOTER, India TV – CNX, Jefferies
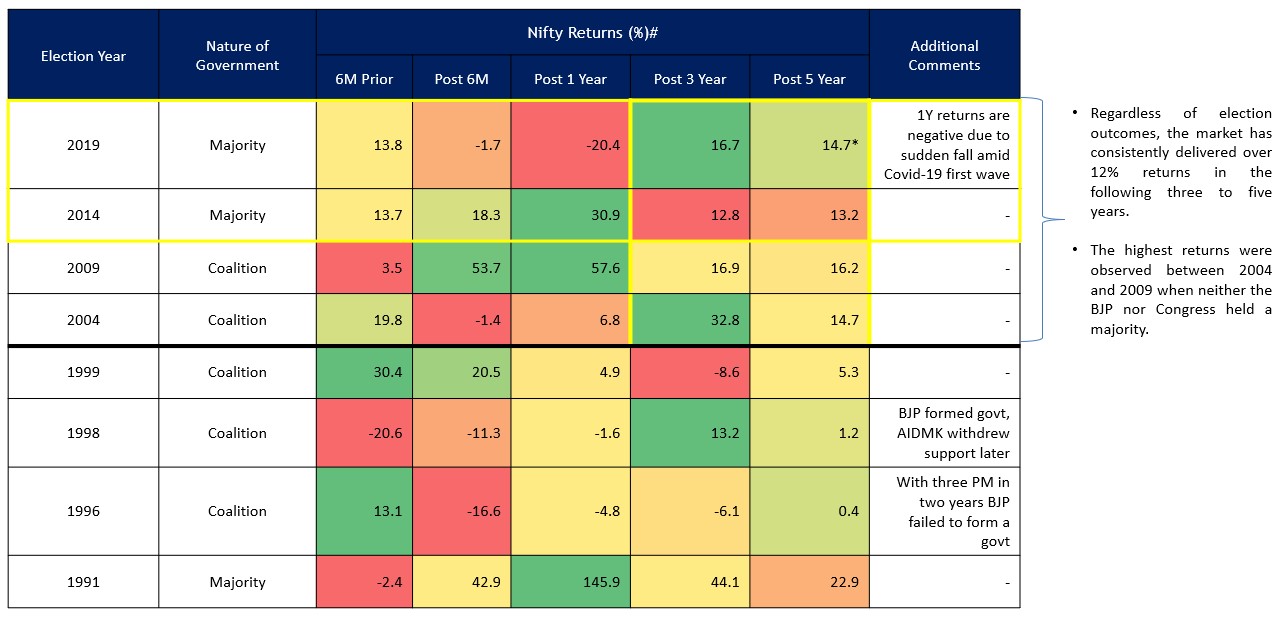
Source: ACE MF, Fisdom Research. *Returns up to 15 September has been considered. #For the period up to Year2000, nifty TRI data has been considered
Returns less than one year is absolute and more than one year is CAGR.
Election Impact on the Mutual Funds
Disciplined investors emerge as the true winners. Even the bottom performers delivered more than 9% in most of the cases.
A 10-year SIP of Rs. 10,000 initiated 6 months before the election.
| Category | Returns | 11-Oct-2018 To 01-Sep-2023 | 01-Oct-2013 To 01-Sep-2023 | 16-Oct-2008 To 01-Oct-2018 |
| Largecap | Top Performer (%) | 20.7 | 15.4 | 17.8 |
| Bottom Performer (%) | 10.8 | 9.6 | 9.3 | |
| Average (%) | 15 | 12.5 | 12.5 | |
| Flexicap | Top Performer (%) | 28.9 | 21 | 16.4 |
| Bottom Performer (%) | 12.1 | 9.9 | 8.6 | |
| Average (%) | 17.2 | 14.4 | 13.3 | |
| Midcap | Top Performer (%) | 30.5 | 20 | 19.6 |
| Bottom Performer (%) | 18.2 | 15.1 | 9.9 | |
| Average (%) | 23.6 | 17.5 | 17 | |
| Smallcap | Top Performer (%) | 42.2 | 24.9 | 20.6 |
| Bottom Performer (%) | 23 | 15.4 | 7.9 | |
| Average (%) | 30.1 | 20.5 | 15.6 | |
| Aggressive Hybrid | Top Performer (%) | 23.1 | 17.7 | 15.4 |
| Bottom Performer (%) | 10.2 | 8.6 | 7.8 | |
| Average (%) | 14.8 | 12.3 | 12.1 | |
| Balanced Advantage | Top Performer (%) | 20.2 | 15.2 | 13 |
| Bottom Performer (%) | 8.3 | 7.6 | 9.9 | |
| Average (%) | 11.2 | 10.2 | 11.9 |
Source: ACE MF, Fisdom Research.
Election Impact on the FPI Flows
Typically, FII inflows tend to be robust during election years.
FPI flows as % of marketcap:
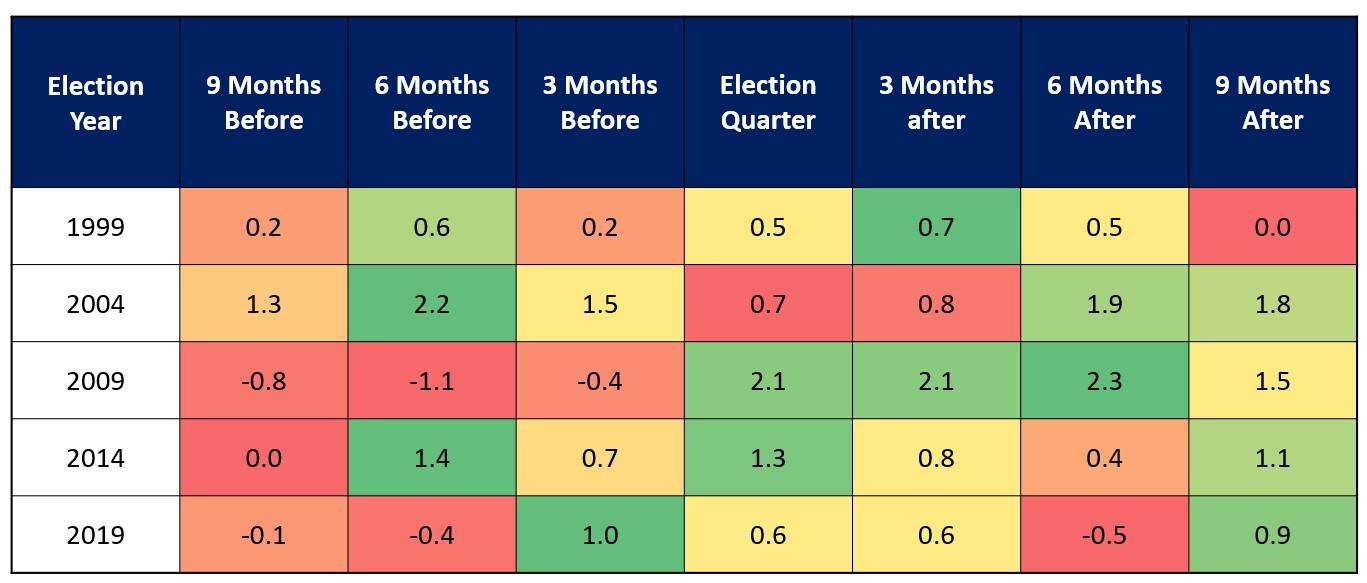
Historical data indicates that FPI inflows tend to respond positively before and after general elections.
Source: Deutsche Bank report, Edelweiss MF, Fisdom Research.