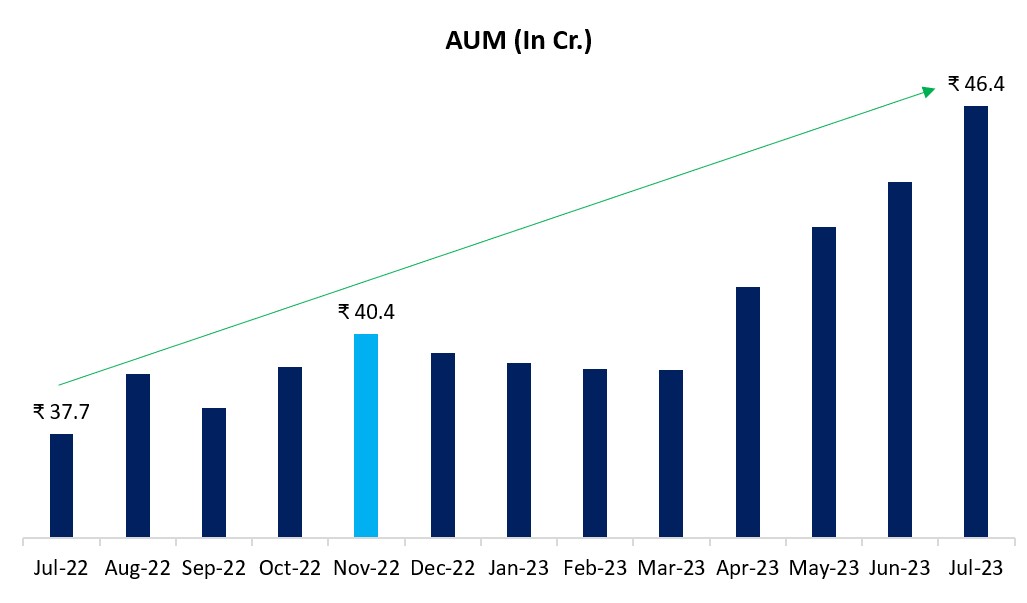
In July 2023, the Mutual Fund industry achieved an impressive feat by soaring past the Rs 46 lakh crore milestone in average Assets Under Management (AUM). Notably, the industry’s AUM reached a substantial Rs 46.28 lakh crore, signifying an impressive 23% surge compared to the preceding year.
A significant portion of this growth can be attributed to the active participation of retail investors. With contributions from equity, hybrid, and solution-oriented schemes, retail investors have collectively injected Rs 23.77 lakh crore into the industry. This impressive figure surpasses 51% of the total AUM, underscoring the crucial role played by retail investors in shaping the industry’s expansion.
In a historic milestone, the industry witnessed the crossing of the Rs 15,000 crore threshold in gross Systematic Investment Plan (SIP) inflows. This achievement was marked by total SIP inflows reaching Rs 15,245 crore, a significant achievement for SIP investments, reflecting their growing popularity and acceptance among investors.
In an encouraging shift, the overall industry inflows turned positive, registering an inflow of Rs 82,046 crore as compared to the data from June 2023.
Two pivotal factors can be attributed to this remarkable growth in AUM. Furthermore, robust inflows in debt categories have further fueled the industry’s expansion.
In the last 7 months so far in CY2023 Equity AUM has grown by 21% till July 2023. All categories witnessed AUM growth in July 2023 with Multicap and small cap category leading the board. Small cap fund recorded an AUM growth for 13th straight month.
In July 2023. small cap funds received the most inflows, totaling Rs. 4,171 crore, the highest inflows within the equity category for the 4th straight month. Multi cap funds came next, getting Rs. 1,623 crore inflows. However, the inflows coming into all equity funds decreased from Rs. 8,637 crore in June 2023 to Rs. 7,626 crore in July 2023.
This happened because of profit booking in large cap funds, which resulted in Rs. 1,880 crore outflows. Focused funds also saw outflows of about Rs. 1,067 crore. A similar trend was seen in ELSS and flexi cap funds. Despite this, the overall AUM of these categories went up.
This was mainly because the market performed very well in July 2023. The Nifty 50 index went up by about 3%, while the Nifty Midcap 150 and Nifty Smallcap 250 indices did even better, rising by 5.5% and 8% respectively. So, even though there was a bit less new inflows, the AUM still grew because of the good market performance.
Debt flows turn positive; AUM growth at 5.2 percent
Category AUM
Jul-23
Jun-23
% Change
Liquid Fund
₹ 4,74,198
₹ 4,19,556
13.0%
Low Duration Fund
₹ 1,06,720
₹ 99,019
7.8%
Money Market Fund
₹ 1,49,582
₹ 1,40,035
6.8%
Floater Fund
₹ 60,641
₹ 58,175
4.2%
Medium to Long Duration Fund
₹ 10,256
₹ 9,884
3.8%
Ultra Short Duration Fund
₹ 1,00,630
₹ 97,161
3.6%
Gilt Fund
₹ 23,255
₹ 22,703
2.4%
Long Duration Fund
₹ 9,315
₹ 9,183
1.4%
Corporate Bond Fund
₹ 1,36,964
₹ 1,35,476
1.1%
Dynamic Bond Fund
₹ 30,410
₹ 30,210
0.7%
Short Duration Fund
₹ 99,382
₹ 99,139
0.2%
Medium Duration Fund
₹ 27,404
₹ 27,349
0.2%
Credit Risk Fund
₹ 24,294
₹ 24,325
-0.1%
Gilt Fund with 10 year duration
₹ 4,219
₹ 4,230
-0.3%
Banking and PSU Fund
₹ 80,959
₹ 81,815
-1.0%
Overnight Fund
₹ 79,008
₹ 89,223
-11.4%
Total
₹ 14,17,238
₹ 13,47,483
5.2%
Category Inflow/Outflow
Jul-23
Jun-23
Liquid Fund
₹ 51,938
₹ -28,545
Money Market Fund
₹ 8,608
₹ 6,827
Low Duration Fund
₹ 7,027
₹ 3,358
Ultra Short Duration Fund
₹ 2,865
₹ -1,887
Floater Fund
₹ 2,000
₹ 1,847
Corporate Bond Fund
₹ 648
₹ 552
Gilt Fund
₹ 469
₹ 396
Medium to Long Duration Fund
₹ 316
₹ -23
Long Duration Fund
₹ 114
₹ 8
Dynamic Bond Fund
₹ 67
₹ 139
Gilt Fund with 10 year constant duration
₹ -18
₹ -5
Medium Duration Fund
₹ -68
₹ -128
Credit Risk Fund
₹ -166
₹ -318
Short Duration Fund
₹ -305
₹ -187
Banking and PSU Fund
₹ -1,310
₹ -799
Overnight Fund
₹ -10,747
₹ 4,628
Total
₹ 61,440
₹ -14,136
Debt AUM witnessed a overall AUM growth of 5.2 percent on month on month basis in July 2023. Within the debt category, excluding liquid and overnight funds, low duration funds and money market funds saw the most significant growth in their value, increasing by 7.8% and 6.8% respectively. All debt subcategories, except Banking & PSU funds and credit risk funds, observed a rise in AUM compared to the previous month.
In the world of investments, the flow of money in debt-related funds showed a positive trend with a total increase of Rs. 61,440 crore. This boost was mainly because of the inflows into liquid funds, which gained the most at Rs. 51,938 crore. Money market funds and low duration funds also received considerable new investments, with Rs. 8,608 crore and Rs. 7,027 crore respectively. However, this positive shift was somewhat offset by money moving out from overnight funds (Rs. 10,747 crore) and banking & PSU funds (Rs. 1,310 crore).
During this period, debt-oriented funds (excluding liquid and overnight funds) attracted inflows of Rs. 20,248 crore. Money market funds experienced the highest inflows of Rs. 8,608 crore, followed by low duration funds with net inflows of Rs. 7,027 crore. On the other hand, Banking and PSU funds faced the highest outflows, with Rs. 1,310 crore leaving during the month.
Download the full report to get the complete coverage