
The mutual fund industry AUM overview
MF AUM hits a record high of over Rs. 44 trillion for the first time
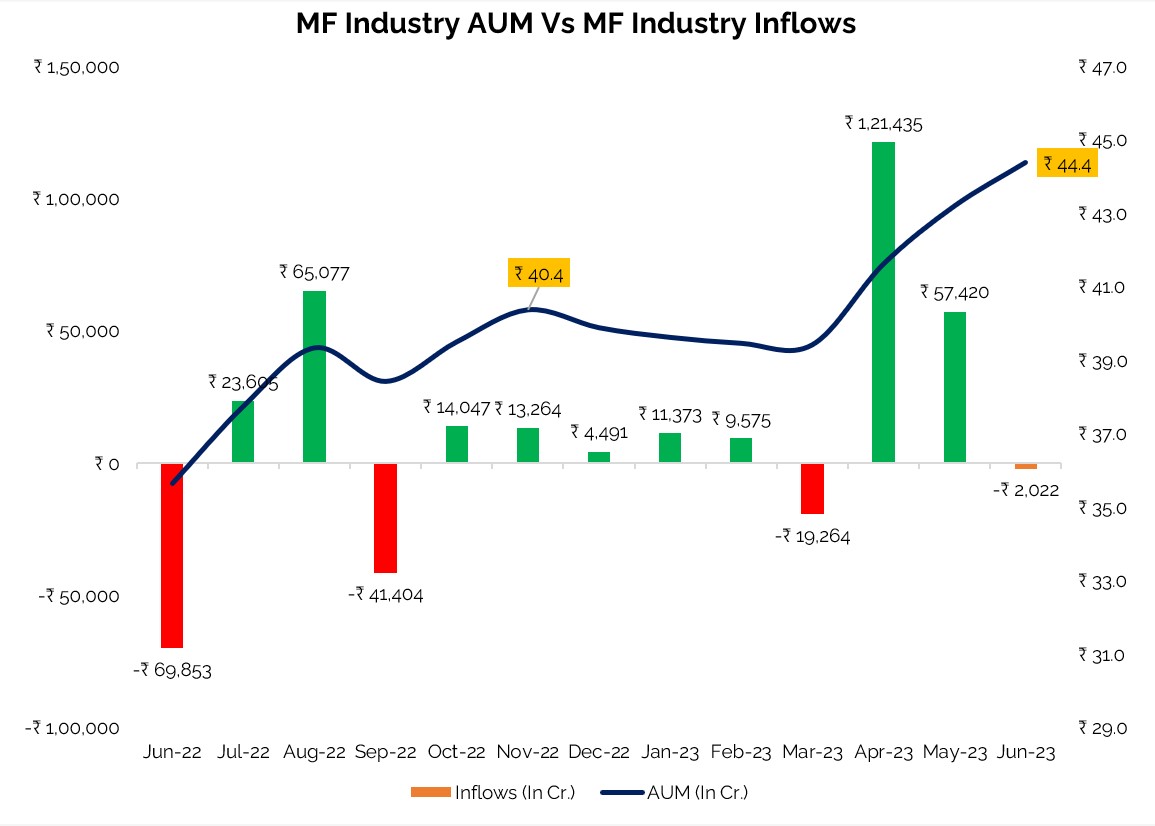
- The mutual fund industry has achieved yet another significant milestone, surpassing the Rs. 44 trillion assets under management (AUM) mark for the very first time in June 2023. In May as well the overall industry surpassed Rs 43 trillion mark This noteworthy accomplishment reflects a year-on-year growth of 25 percent, accompanied by a monthly increase of 2.7 percent in June 2023.
- The impressive expansion of AUM can be attributed to two key factors. Firstly, a remarkable rally in the equity markets has played a pivotal role in driving this growth. The buoyant performance of broader equity market has garnered to the overall expansion of AUM.
- Secondly, the inflows into the equity category has also played a role in bolstering the industry’s growth..
- However, it is worth noting that the flow of funds into the equity category has shown signs of moderation. While the overall growth in AUM remains robust, the pace of inflows into equity funds has tapered off, suggesting a possible shift in investor preferences and market dynamics.
- Looking forward, the industry’s growth trajectory is expected to be driven by the movement in the broader market indices. Currently, we are cautiously optimistic about the industry’s AUM growth.
Source: ACE MF,AMFI, Fisdom Research
AUM overview: Core Equity Categories
Equity funds see AUM growth in June 2023, Inflows continue in small caps and value category.
Category-wise AUM (In Cr)
| Category | Jun-23 | May-23 | % Change |
| Small Cap Fund | ₹ 1,68,434 | ₹ 1,53,807 | 9.5% |
| Value Fund/Contra Fund | ₹ 1,04,686 | ₹ 97,844 | 7.0% |
| Dividend Yield Fund | ₹ 16,237 | ₹ 15,210 | 6.8% |
| Mid Cap Fund | ₹ 2,18,146 | ₹ 2,04,480 | 6.7% |
| Multi Cap Fund | ₹ 78,415 | ₹ 74,017 | 5.9% |
| Large & Mid Cap Fund | ₹ 1,48,218 | ₹ 1,40,558 | 5.4% |
| Sectoral/Thematic Funds | ₹ 1,96,178 | ₹ 1,86,685 | 5.1% |
| ELSS | ₹ 1,71,034 | ₹ 1,63,767 | 4.4% |
| Flexi Cap Fund | ₹ 2,72,743 | ₹ 2,62,587 | 3.9% |
| Large Cap Fund | ₹ 2,59,583 | ₹ 2,51,232 | 3.3% |
| Focused Fund | ₹ 1,09,698 | ₹ 1,06,413 | 3.1% |
| Total | ₹ 17,43,373 | ₹ 16,56,600 | 5.2% |
Category-wise inflows (In Cr.)
| Category | Jun-23 | May-23 |
| Small Cap Fund | ₹ 5,472 | ₹ 3,283 |
| Value Fund/Contra Fund | ₹ 2,239 | ₹ 582 |
| Dividend Yield Fund | ₹ 398 | ₹ 289 |
| Mid Cap Fund | ₹ 1,749 | ₹ 1,196 |
| Multi Cap Fund | ₹ 735 | ₹ 105 |
| Large & Mid Cap Fund | ₹ 1,147 | ₹ 1,133 |
| Sectoral/Thematic Funds | ₹ 459 | ₹ -169 |
| ELSS | ₹ -475 | ₹ -505 |
| Flexi Cap Fund | ₹ -17 | ₹ -368 |
| Large Cap Fund | ₹ -2,050 | ₹ -1,362 |
| Focused Fund | ₹ -1,018 | ₹ -944 |
| Total | ₹ 8,637 | ₹ 3,240 |
- Equity assets under management (AUM) experienced grew by 5.2% on a month-on-month in June 2023. During the same time, equity inflows showed a further resilience. The rise in AUM can be attributed to both the rise in inflows and buoyant market performance. Investors continued their optimism around small caps, and value/contra funds, leading to a shift in investment preferences.
- The growth in equity AUM during June 2023 can also be attributed to the performance of broader market indices. Notably, the Nifty Midcap 150 and Nifty Small Cap 250 indices saw significant increases of 6.2% and 6.4%, respectively, compared to the Nifty 50 which rose by 3.5%. Further Large market cap oriented categories witnessed outflows.
Source: ACE MF,AMFI, Fisdom Research
AUM overview: Core Debt Categories
Debt AUM declines; Short duration categories witness outflows
Category-wise AUM (In Cr)
| Category | Jun-23 | May-23 | % Change |
| Overnight Fund | ₹ 89,223 | ₹ 81,981 | 8.8% |
| Money Market Fund | ₹ 1,40,035 | ₹ 1,32,362 | 5.8% |
| Floater Fund | ₹ 58,175 | ₹ 55,375 | 5.1% |
| Low Duration Fund | ₹ 99,019 | ₹ 95,129 | 4.1% |
| Gilt Fund | ₹ 22,703 | ₹ 22,283 | 1.9% |
| Corporate Bond Fund | ₹ 1,35,476 | ₹ 1,34,409 | 0.8% |
| Dynamic Bond Fund | ₹ 30,210 | ₹ 30,012 | 0.7% |
| Short Duration Fund | ₹ 99,139 | ₹ 98,985 | 0.2% |
| Banking and PSU Fund | ₹ 81,815 | ₹ 81,846 | 0.0% |
| Medium to Long Duration Fund | ₹ 9,884 | ₹ 9,904 | -0.2% |
| Medium Duration Fund | ₹ 27,349 | ₹ 27,419 | -0.3% |
| Gilt Fund with 10 year constant duration | ₹ 4,230 | ₹ 4,246 | -0.4% |
| Credit Risk Fund | ₹ 24,325 | ₹ 24,559 | -1.0% |
| Long Duration Fund | ₹ 9,183 | ₹ 9,284 | -1.1% |
| Ultra Short Duration Fund | ₹ 97,161 | ₹ 98,493 | -1.4% |
| Liquid Fund | ₹ 4,19,556 | ₹ 4,42,875 | -5.3% |
| Total | ₹ 13,47,483 | ₹ 13,49,162 | -0.1% |
Category-wise inflows (In Cr.)
| Category | Jun-23 | May-23 |
| Money Market Fund | ₹ 6,827 | ₹ 8,731 |
| Overnight Fund | ₹ 4,628 | ₹ -18,910 |
| Low Duration Fund | ₹ 3,358 | ₹ 1,747 |
| Floater Fund | ₹ 1,847 | ₹ -2,378 |
| Corporate Bond Fund | ₹ 552 | ₹ 622 |
| Gilt Fund | ₹ 396 | ₹ -128 |
| Dynamic Bond Fund | ₹ 139 | -₹ 287 |
| Long Duration Fund | ₹ 8 | ₹ 71 |
| Gilt Fund with 10 year constant duration | ₹ -5 | ₹ -197 |
| Medium to Long Duration Fund | ₹ -23 | ₹ 189 |
| Medium Duration Fund | ₹ -128 | ₹ -209 |
| Short Duration Fund | ₹ -187 | ₹ 4,055 |
| Credit Risk Fund | ₹ -318 | ₹ -289 |
| Banking and PSU Fund | ₹ -799 | ₹ 123 |
| Ultra Short Duration Fund | ₹ -1,887 | ₹ 7,585 |
| Liquid Fund | ₹ -28,545 | ₹ 45,234 |
| Total | ₹ -14,136 | ₹ 45,959 |
In June 2023, the debt mutual fund category experienced a marginal decline in AUM of 0.1 percent when compared on a month-on-month basis. This decline followed two consecutive months of net inflows, as debt mutual fund schemes faced net outflows during June. The segment witnessed a net outflow of Rs 14,136 crore, with a significant portion attributed to liquid funds and ultra-short-duration funds, accounting for over Rs 30,000 crore in outflows. On the other hand, money market funds and short-duration funds saw net flows of Rs 10,185 crore.
These outflows were anticipated due to the nature of June being the quarter end, when corporates typically make advance tax payments. Additionally, the benchmark 10-year government securities (gsec) yield also experienced a notable increase of 1.7% in June 2023. This marks a shift from the preceding three months, which witnessed a continuous decline in yields.
Source: ACE MF,AMFI, Fisdom Research