
Realty Sector
Top Five Nifty Realty Index Constituents
The underlying stock has achieved outstanding returns over the past year.
| Stock Name | Market Cap Type | Weightage | CMP | High | 1Y Returns % |
| DLF Ltd. | Large Cap | 28.97% | 823 | 941 | 122.5% |
| Macrotech Developers Ltd. (Lodha) | Large Cap | 16.16% | 1,081 | 1,277 | 150.8% |
| Phoenix Mills Ltd. | Mid Cap | 13.48% | 2,633 | 2,971 | 103.4% |
| Godrej Properties Ltd. | Mid Cap | 12.05% | 2,135 | 2,541 | 94.2% |
| Oberoi Realty ltd. | Mid Cap | 8.78% | 1,360 | 1,585 | 58.2% |
| Total | 79.44% | — | — | — |
Going Ahead, Nifty Realty Index could lag Nifty 50
The NIFTY/CNX REALTY INDEX ratio chart indicates an intermediate bottoming-out pattern.
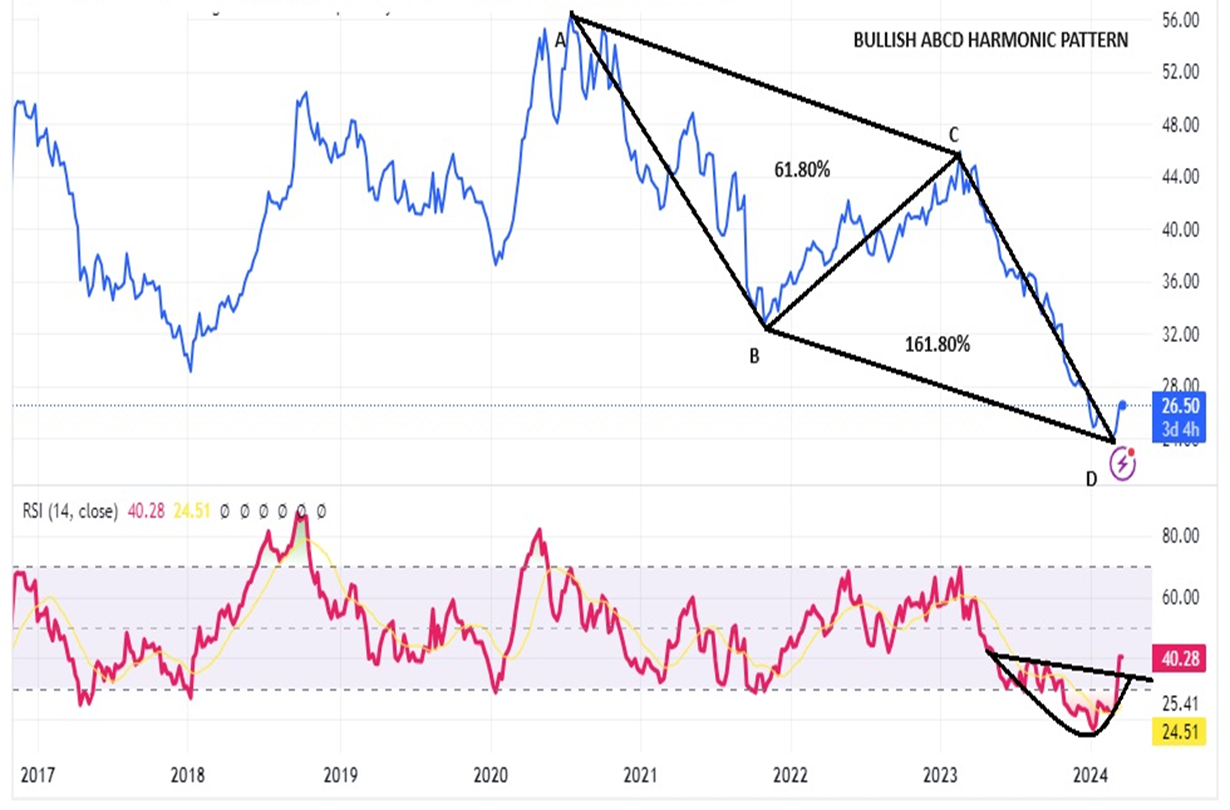
- The NIFTY/CNX REALTY INDEX ratio chart indicates an intermediate bottoming-out pattern.
- This suggests that the Realty index will probably underperform the Benchmark index in the upcoming weeks.
- The weekly chart shows a Bullish ABCD Harmonic Pattern, which is a reversal pattern.
- The ratio has surpassed its Potential Reversal Zone (PRZ) levels, further supporting the reversal pattern.
- Additionally, the momentum oscillator RSI (14) has reversed from oversold zones (20) and risen above 40 levels, indicating increasing bullish momentum.
DLF Ltd.
Bearish Signals on Weekly Chart
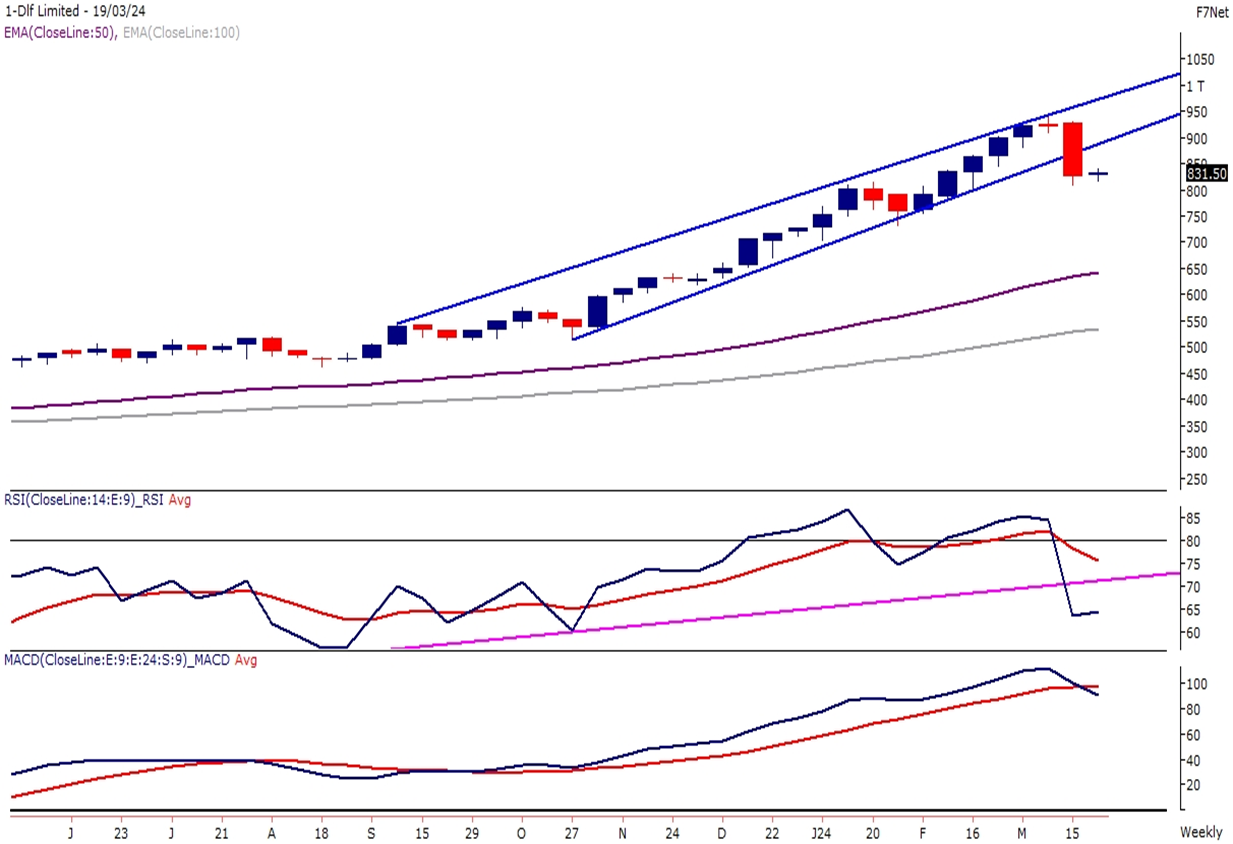
- DLF’s weekly chart indicates a breakdown of a rising channel pattern, with prices trading below the lower band of the pattern.
- The Index has formed a tall bearish belt hold candle on the weekly chart, indicating profit booking from higher levels.
- The momentum oscillator RSI (14) has experienced a breakdown of an upward rising trend line below 65 levels, accompanied by a bearish crossover.
Macrotech Developers Ltd.
Bearish Signals Amidst Rectangle Pattern
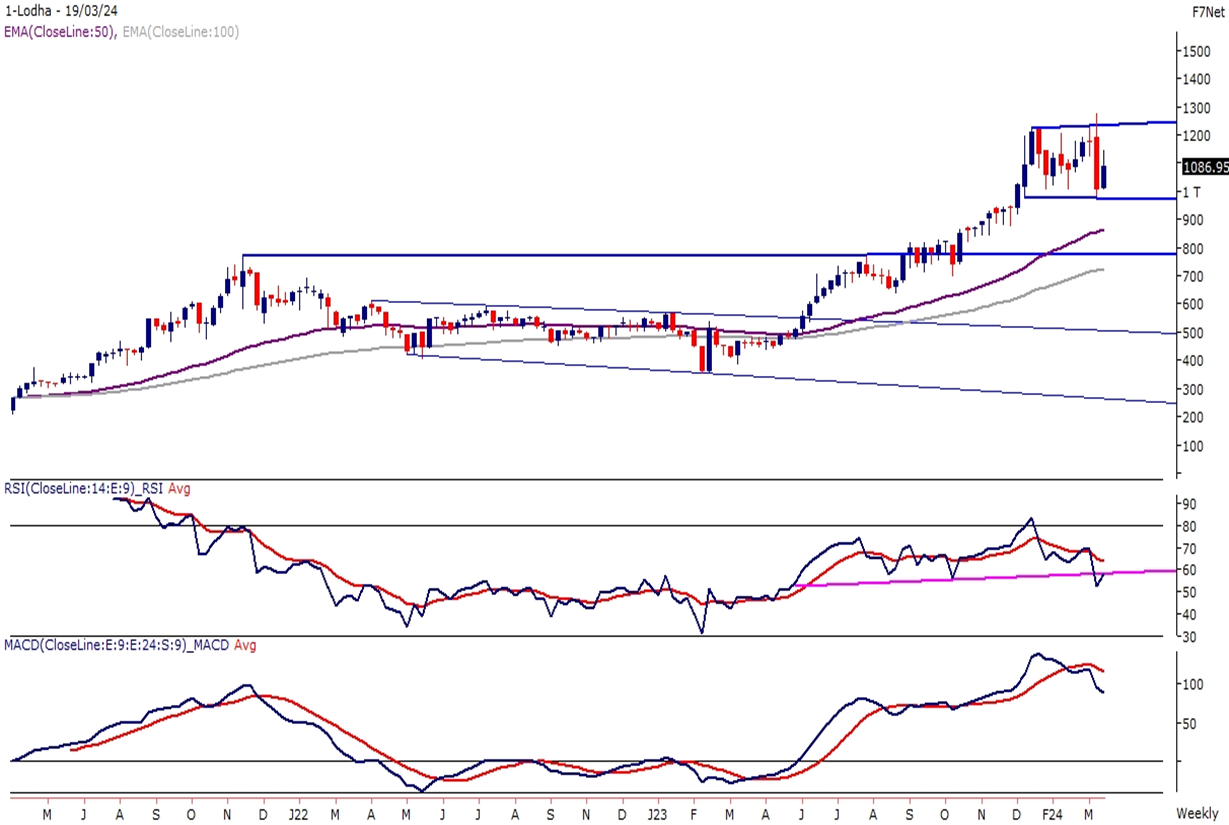
- LODHA on the weekly chart is confined within a rectangle pattern following a peak near 1300 levels.
- A bearish engulfing candlestick pattern has emerged on the weekly chart, with the pattern’s high serving as immediate resistance.
- The momentum oscillator RSI (14) has exhibited a bearish divergence close to 80 levels, subsequently declining towards 60 levels, indicating weakening momentum.