Sectoral Technical Outlook (1/2)
| Index Name | Trend | Pattern/Formation | Strategy |
| Realty | The index is in a pullback mode and prices are retesting their resistance levels on the weekly time frame | INDEX on the weekly chart has witnessed a rising wedge pattern breakdown and the index is trading below the lower band of the pattern | The upper band is likely to be capped below 950 levels. A convincing move on either side of the levels will initial the further trigger. |
| Auto | Index has outperformed the Benchmark index in recent times and the majority of Auto stocks have witnessed a bullish breakout indicating a bullish trend in the Index | Index has moved above the upper band of the upper band of the rising channel pattern and continues to move higher with a strong bullish bias | Partially long at current levels and will wait for a dip will 20,400 levels, with immediate support near 19,200 levels and the upside capped below 21,800 – 22,000 levels |
| Industrial | The rising channel pattern indicating a perfect bullish trend is unfolding | Index is trading in a higher high higher low formation within | The bullish move is expected to continue ahead where the support is placed at 11,500 |
| Capital Goods | The prices are sustaining above the upper band of the flag pattern | Bullish flag pattern breakout | A breakout above 60,000 levels will initiate a strong force on the higher side towards 63,000 levels. |
| Telecom | Over the past few weeks, the volatility has increased a bit and prices witnessing a strong swing from both ends. | Index is trading in a higher high higher low formation within the rising channel pattern indicating a perfect bullish trend is unfolding | The bullish move is expected to continue ahead where the support is placed at 2,300. |
| Bankex | Has formed consecutive bullish candles on the weekly chart. | Formed a hammer candle stick pattern | Buying at present levels is advisable due to an attractive risk-reward ratio. Consider going long at the current stage for a target at 54,800 – 55,300 levels, with immediate support at 51,800 – 51,000 levels |
Sectoral Technical Outlook (2/2)
| Index Name | Trend | Pattern/Formation | Strategy |
| Energy | The Index has formed a tall red candle that has engulfed its previous five weeks’ | The weekly chart has witnessed a smaller degree rising wedge pattern breakdown | The immediate support for the Index is placed at the 36,800 level and if prices witness a breakdown below this level than 35,500 will be the next level to watch. |
| Healthcare | The index is trading below the lower band of the pattern | INDEX on the weekly chart has witnessed a rising wedge pattern breakdown | The immediate support for the Index is placed at the 33,300 level and if prices witness a breakdown below this level then 32,500 will be the next level to watch. |
| Materials | In this recent correction, the prices have completed the throwback near its trend line support | Index on the weekly time frame has given a triangle pattern breakout | Partially long at current levels and will wait for a dip till 6,400 levels, with immediate support near 6,200 levels and the upside capped below 6,750 – 6,800 levels. |
| FMCG | The index has witnessed a negative breakdown of its channel pattern | Index on the weekly chart is trading in a rising channel pattern | Presently the 50 WEMA is acting as immediate support for the index at 18,700 levels. In case prices breach these levels then the downfall may extend to 18,000 levels. A move above 20,000 will neglect the bearish pattern |
| Consumer Durables | Trading in a higher high higher low formation from the past year suggesting a continuous outperformance against the Benchmark Index | Couple of months back the Index gave an ascending triangle pattern breakout | Partially long at current levels and will wait for a dip till 50,000 levels, with immediate support near 47,000 levels and the move above 53,000 levels will trigger more buying towards 54,500 levels. |
| Information Technology | Index on the weekly has witnessed a sharp profit booking from higher levels post rectangle pattern breakout | Index has formed a bearish engulfing candle stick pattern | The immediate support is placed near the previous breakout levels which are club with a 50 EMA at 33,400 levels and the upside capped below 37,000 levels |
Realty Index 🏡
Nifty Realty Index index is in a pullback mode and prices are retesting their resistance levels
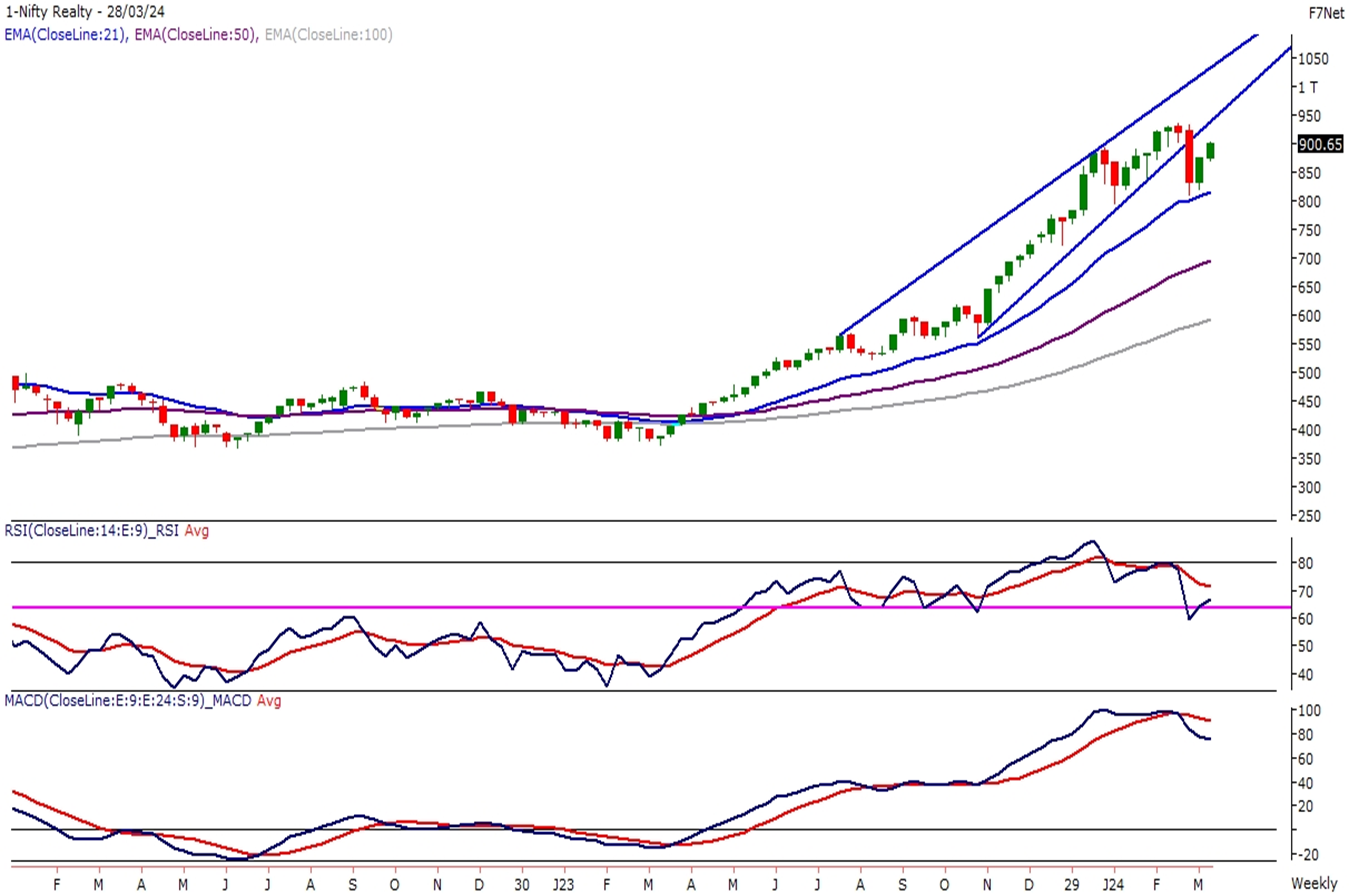
NIFTY REALTY INDEX on the weekly chart has witnessed a rising wedge pattern breakdown and the index is trading below the lower band of the pattern. In this recent breakdown, the Index has formed a tall red candle that has engulfed its previous five weeks’ candles suggesting an integrated profit booking in the Realty Index.
Presently the index is in a pullback mode and prices are retesting their resistance levels on the weekly time frame. On the monthly chart, prices have formed a bearish candle after 6 months which suggests a strong outperformance by Realty stocks.
In the recent drop, prices have found support near its 21 EMA which is placed at 799 levels and will act as an anchor point support for the index. The upper band is likely to be capped below 950 levels. A convincing move on either side of the levels will initial the further trigger.
Auto Index 🚗
NIFTY AUTO Index has moved above the upper band of the upper band of the rising channel pattern
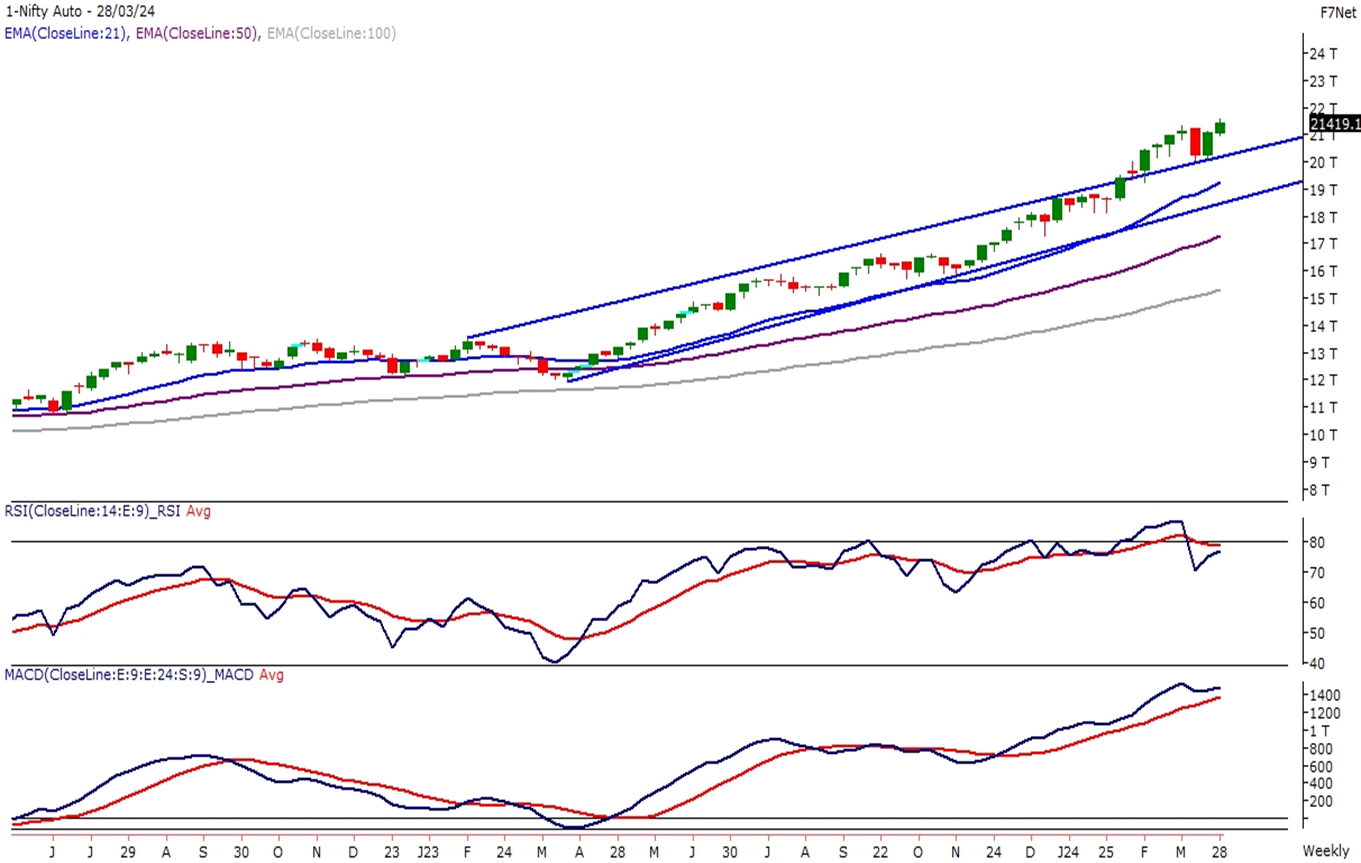
The Nifty Auto Index has moved above the upper band of the upper band of the rising channel pattern and continues to move higher with a strong bullish bias. The Auto Index has outperformed the Benchmark index in recent times and the majority of Auto stocks have witnessed a bullish breakout indicating a bullish trend in the Index.
The momentum oscillator RSI (14) is reading in a bullish range shift between 60 – 90 levels on the weekly scale. The MACD indicator has flattened out but still sustains above its polarity levels with positive crossovers.
Until the higher high higher and low formation is not getting taken off the Auto index will continue to trade higher with continuous outperformance against the Benchmark Index. We will be partially long at current levels and will wait for a dip will 20,400 levels, with immediate support near 19,200 levels and the upside capped below 21,800 – 22,000 levels.