
Realty
Highlights: INDEX witnessed a multiyear rectangle pattern breakout on the monthly time frame
18.3% returns for November 2023
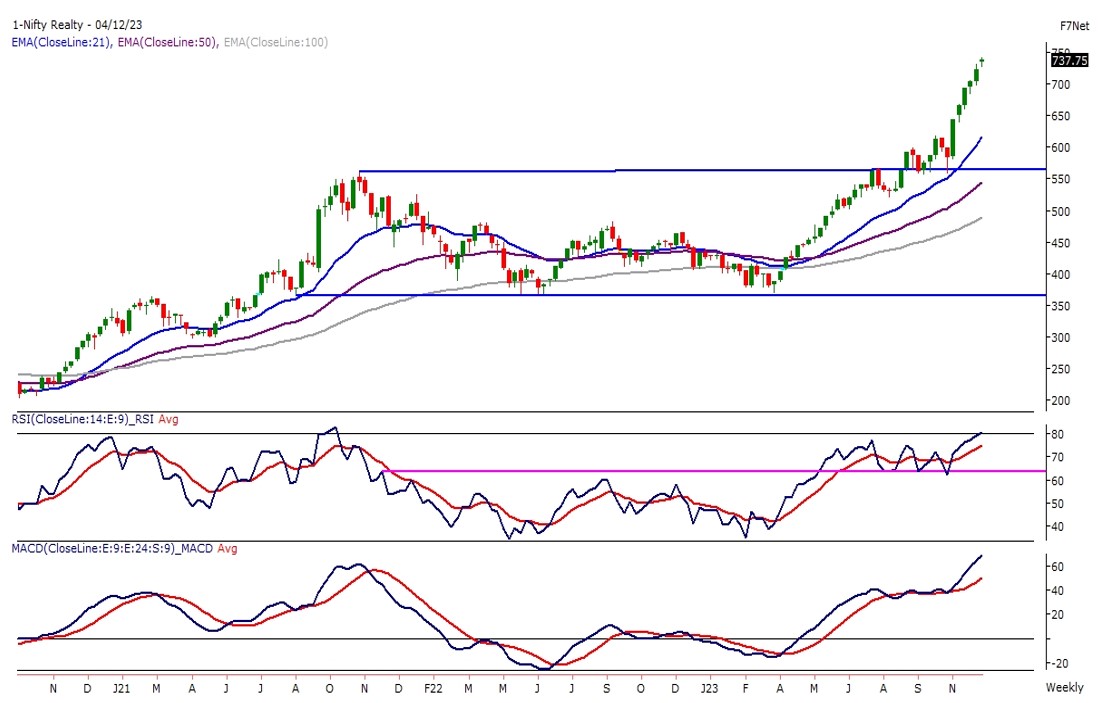
The Realty index is trading at a higher high, forming from the past few months and indicating a perceptual bullish trend in the index. The index has given a massive return of more than 20% in the past six weeks, calling for a strong outperformance against the Benchmark index.
NIFTY REALTY INDEX witnessed a multiyear rectangle pattern breakout on the monthly time frame, and the index is marching higher with all blazing guns. The index trades above its 21, 50, and 100 WEMA, and the momentum oscillator RSI (14) reads above its trend line support with a bullish range shift mode on the weekly scale.
Buying on dips will be an effective strategy after a bullish breakout, as the index is expected to witness a throwback on the broader time trend. One should initiate a half positional at current levels and another half at a dip near 680 levels, with a downside protected at 640 levels and the upside capped below 790 – 810 levels.
Utilities
Highlights: Index has witnessed an intelligent reversal from the lower levels
11.5% returns for November 2023
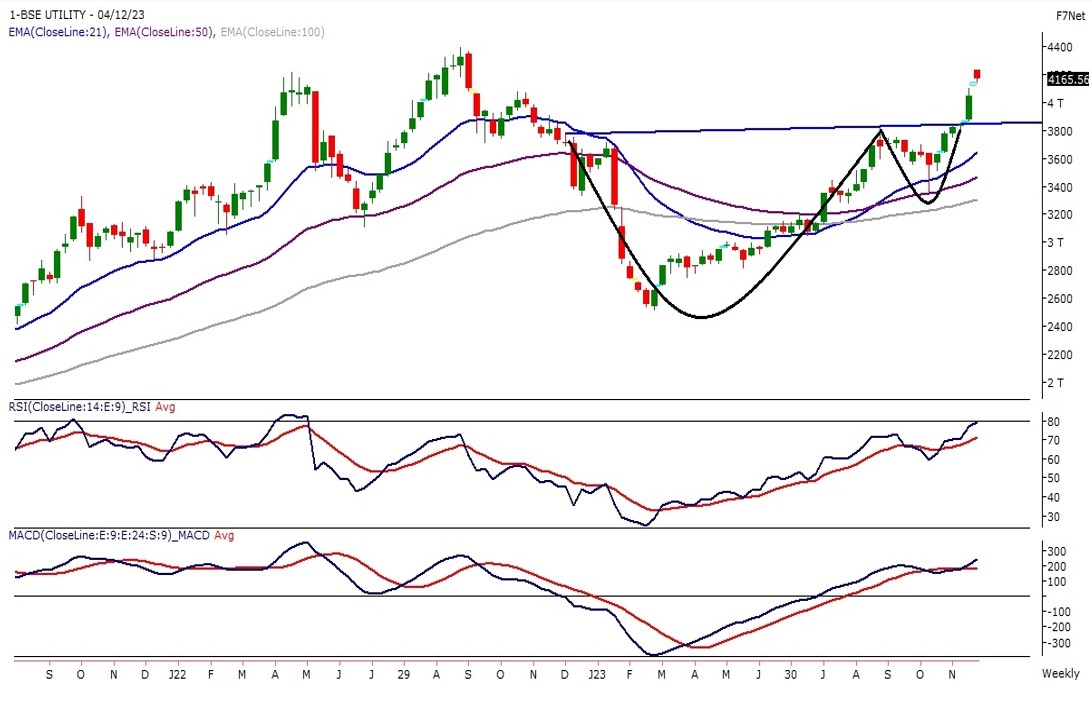
The BASIC UTILITIES Index has witnessed an intelligent reversal from the lower levels. It has formed a sharp V reversal from the lower levels and moved above its short- and medium-term averages. The utility index has given a bullish cup & handle pattern breakout, and the prices are trading above the resistance levels of the pattern.
On the lower panel momentum, oscillator RSI (14) moves in a higher, higher bottom formation with a bullish crossover on the cards. The MACD indicator has moved above its polarity line with a bullish crossover.
Technically, the UTILITIES Index is trading in a bullish terrain, and buying on present levels can be initiated with immediate support of 3,850 – 3,800 levels, and on the higher side, 4,250 – 4,400 are likely to be seen in the index.
Healthcare
Highlights: Index has witnessed a triangle pattern breakout on the monthly time frame, and prices are firmly headed to move higher
11.2% returns for November 2023
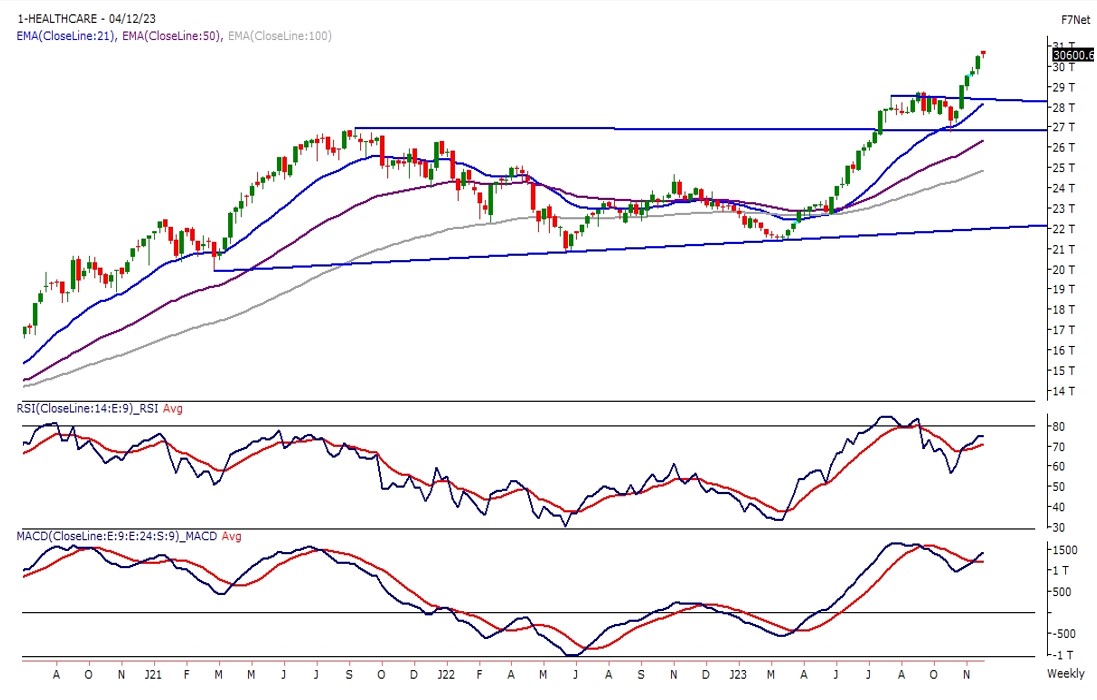
On the weekly time frame, the HEALTHCARE Index has given a rectangle pattern breakout, and in this recent correction, the prices have completed the throwback near their trend line support. Post-throwback, the Index has again resumed its journey towards the north.
The Index has witnessed a triangle pattern breakout on the monthly time frame, and prices are firmly headed to move higher. The momentum oscillator RSI (14) has a drift after forming a top near 85 levels and has taken support near 55 levels. The 21 EMA closely follows the prices and is likely to act as an immediate anchor point for the prices. We will be partially long at current levels and wait for a dip of 29,250 levels, with immediate support near 28,500 levels. On the higher side, the next target for the Index stands near 31,200 – 31,500 levels.
Auto
Highlights: Index on the weekly chart is trading in a rising wedge pattern, and recently, prices have taken support near the lower band
10.3% returns for November 2023
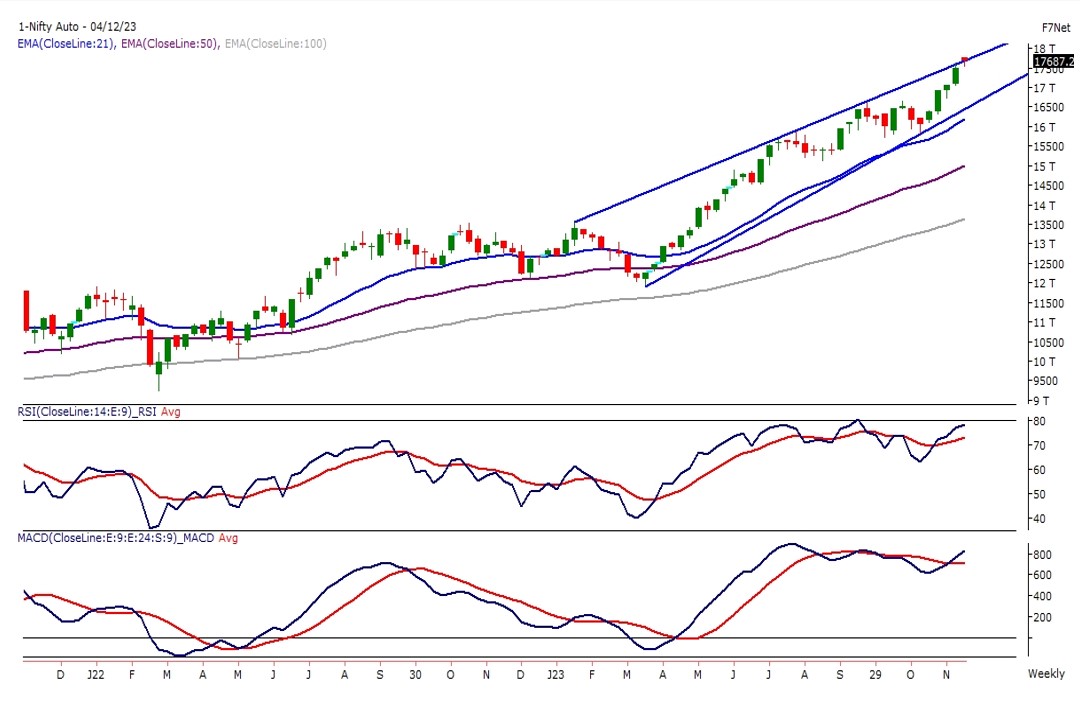
NIFTY AUTO Index on the weekly chart is trading in a rising wedge pattern, and recently, prices have taken support near the lower band of the pattern and delivered more than 9% returns in just six weeks.
The AUTO Index is trading in a higher, higher-low formation and has presently reached near the upper band of the rising wedge pattern. The momentum oscillator RSI (14) has again reached its previous over-bought zones near 80 levels and is likely to face strong resistance near the same levels.
The distance between the closest exponential moving average (21) and the prices have increased, and we may see a profit booking or sideways trend in the coming trading sessions. We will be partially long at current levels and wait for a dip of 17,000 levels, with immediate support near 16,500 levels. If prices witness a breakout above 17,850 levels, the next target for the index stands near 18,250 levels.
Source: BSE, Fisdom Research