📈Sectoral Technical Outlook (1/2)
| Index Name | Trend | Pattern/Formation | Strategy |
| Realty | Reached above its overbought zone | Bearish dark cloud cover candle stick pattern | Trade within the Range between 750 – 950 levels for the coming month with a bearish bias. |
| Auto | Volatility at all-time high levels | Daily chart prices have formed a horizontal channel formation | Prices to trade within the range of 17,500 – 19,900 levels. A dip within the range near 18,000 – 17,500 will provide an opportunity to go long. |
| Industrial | Prices are sustaining above the upper band of the bullish pattern | Breakout of a horizontal flag pattern | Partially long at current levels and will wait for a dip will 11,600 levels, with immediate support near 11,000 levels and the upside capped below 12,900 – 13,400 |
| Capital Goods | Prices are sustaining above the upper band of the bullish pattern | Breakout of a horizontal flag pattern | Partially long at current levels and will wait for a dip will 56,000 levels, with immediate support near 53,000 levels and the upside capped below 60,000 – 60,500 levels |
| Telecom | Continuation of bullish momentum | Rectangle pattern breakout | Partially long at current levels and will wait for a dip will 2,300 levels, with immediate support near 2,200 levels and the upside capped below 2,500 – 2,550 levels. |
| Bankex | Profit booking from the higher levels | Support near 21 WEMA, moving higher | Going long at current stage, target 55,500 – 55,700, support at 52,500 – 51,500 |
📈Sectoral Technical Outlook (2/2)
| Index Name | Trend | Pattern/Formation | Strategy |
| Energy | Bullish inverted head & shoulder pattern breakout | Higher high higher bottom formation | Buying on dips will be an effective strategy after a bullish breakout as the index is expected to witness a throwback on the broader time trend as the oscillator has reached at its overbought zone. |
| Healthcare | Structural bullish trend | Higher high higher low formation | Partially long at current levels. On the higher side, the next target for the index stands near the 34,300 – 34,700 levels |
| Materials | Triangle pattern breakout | Bullish crossover on the weekly time frame | Going long at the current stage is advisable for a higher level at 6,750 – 6,825 levels with immediate support at 6,300 – 6,200 levels. |
| FMCG | Rising channel pattern | Presently approaching the lower band of the channel pattern | A breakdown below 19,200 will trigger a bearish momentum in the FMCG index. The sustainable move above 20,500 will extend buying to 21,000 levels. |
| Consumer Durables | Suggesting a profit booking or throwback near the pattern | Triangle pattern breakout | Index may drift further more till 49,000 – 48,000 levels where it is expected to take support near its previous breakout levels |
| Information Technology | Breakout of rectangle pattern | Higher high higher low formation | Index is trading in a bullish terrain and buying on present levels can be initiated and on dips near 35,000 with immediate support of 34,300 – 34,000 levels |
Realty Index 🏡
Nifty Realty Index has formed a bearish dark cloud cover candle stick pattern
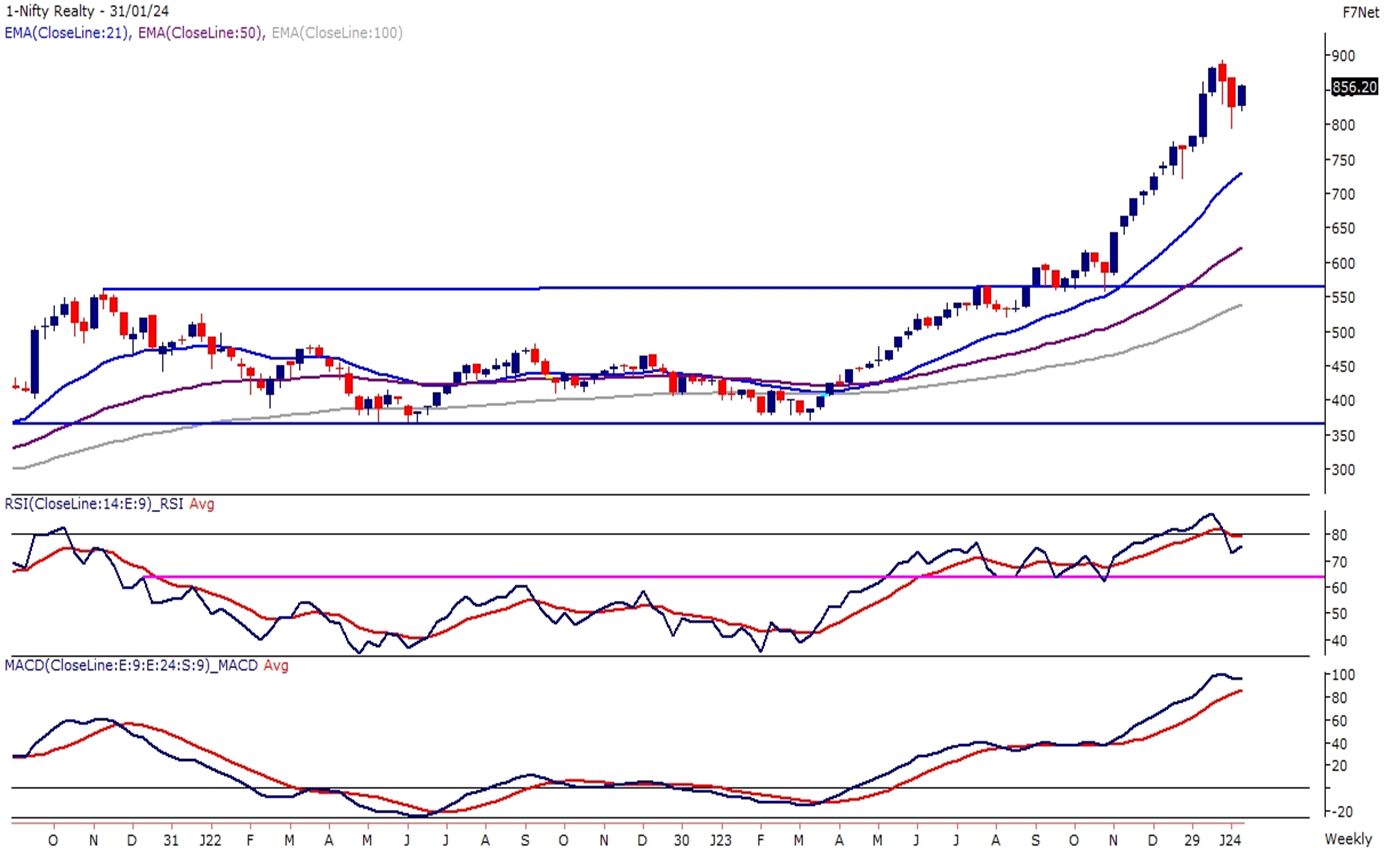
- After a strong outperformance against the benchmark index, the Nifty Realty Index has formed a bearish dark cloud cover candle stick pattern on the weekly time frame. After creating a bearish candlestick pattern, the index witnessed a negative closing below the low point of the bearish formation, indicating an intermediate top in the Realty Index.
- The momentum oscillator RSI (14) has reached above its overbought zone, which is above 80 levels, and drifted lower, with a bearish crossover on the cards. The index is still trading above its 21 and 50 EMAs, as the recent run-up was very strong and fast.
- We expect the Realty Index to trade within the range between 750 and 950 levels for the coming month with a bearish bias.
Auto Index 🚗
NIFTY AUTO Index on the weekly chart is trading in a rising wedge pattern.
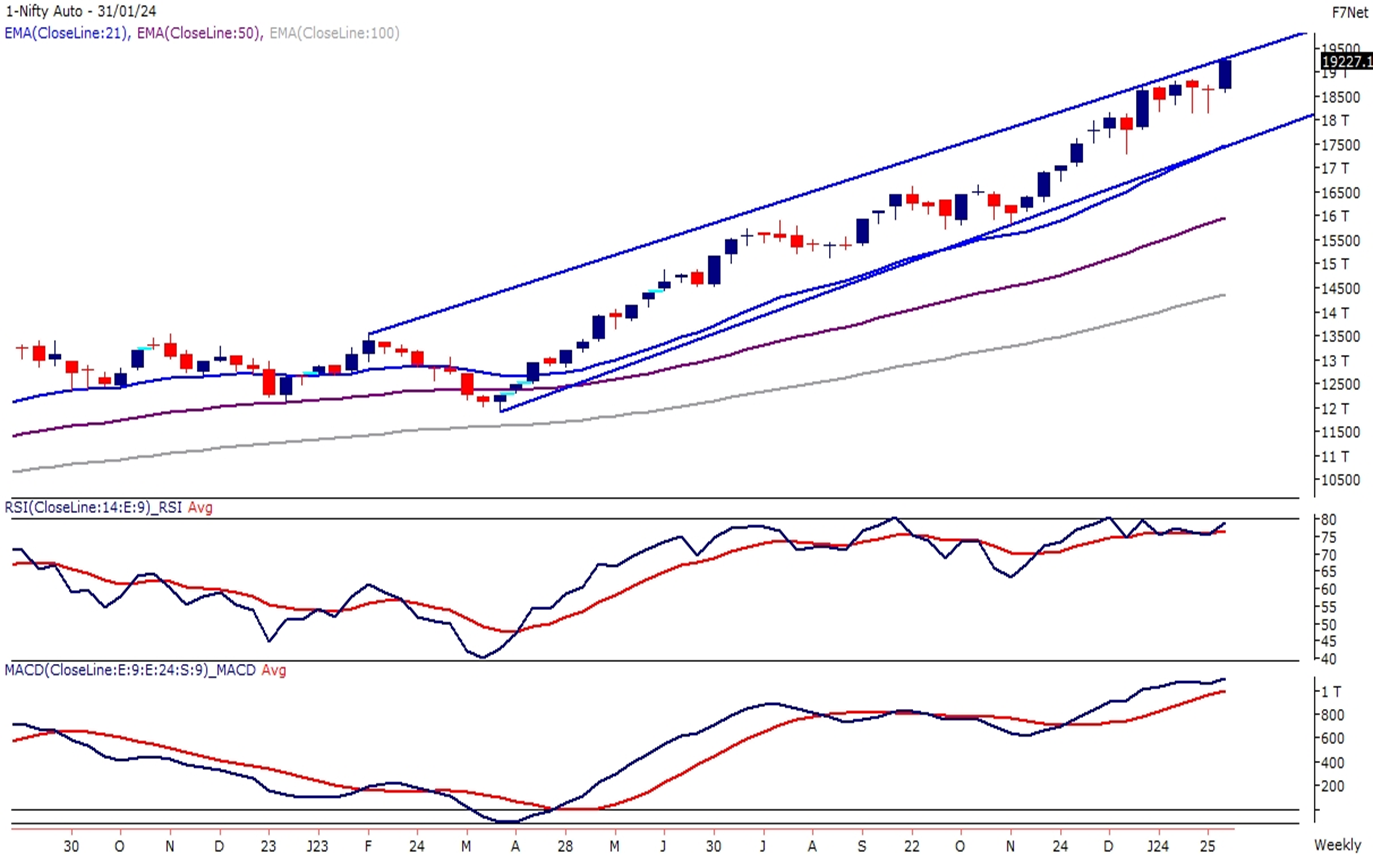
- The NIFTY AUTO Index on the weekly chart is trading in a rising wedge pattern. Recently, prices have reached near the upper band of the pattern and have formed consecutive small candles with long wicks, which indicates volatility at all-time high levels.
- On the daily chart, prices have formed a horizontal channel formation, and the pattern breakout is expected to be above 18,900 levels. The momentum oscillator RSI (14) is reading in a bullish range shift zone between 60 – 90 levels, indicating a strong bullish momentum in the Index.
- As the Auto Index prices have reached near the pattern’s upper band, we expect prices to trade within the range of 17,500 – 19,900 levels. A dip near 18,000 – 17,500 will be another opportunity too long in the Auto Index.