
Sector Summary At Glance (1/2)
| Index Name | Pattern Formation | Strategy | View |
| Realty | Falling channel breakout on the weekly chart with strong bullish confirmation. | Buy near current levels with a stop-loss below 850; ride the trend towards 1050–1100 targets. | Positive bias continues |
| Auto | Falling wedge breakout on weekly timeframe with confirmation from RSI and price action. | Buy near current levels with a stop-loss below 22000; potential upside towards 24200–25000. | Positive; trend reversal confirmed with strong technical signals and key support at 100 EMA. |
| Industrial | Triangle breakout confirmed on weekly and monthly charts, indicating strength and continuation. | Buy near current levels with a stop-loss below 13500; target 16000 in the medium term. | Strong positive outlook; monthly breakout signals potential for sustained upside. |
| Capital Goods | Bullish continuation supported by strong price and volume action | Buy near current levels with stop-loss below 66000; ride the trend towards 75000–76100. | Positive outlook; strong technical confirmation from momentum and moving averages supports further upside. |
| Telecom | Inverted Head & Shoulders breakout on weekly timeframe with strong price follow-through. | Inverted Head & Shoulders breakout on weekly timeframe with strong price follow-through. | Positive outlook; trend reversal confirmed with strong technical signals and institutional-style buying. |
| Bankex | Rectangle breakout on monthly timeframe, backed by volume and momentum strength. | Buy Near Current Levels, With Support at 58,000 | Strong Bullish Momentum, Targeting 66,000–67,000 with Institutional Interest |
Sector Summary At Glance (2/2)
| Index Name | Pattern Formation | Strategy | View |
| Energy | Weekly consolidation breakout confirmed by reversal signals and Fibonacci support base. | Buy near current levels with a stop-loss below 34000; target 37500–38500 on continuation. | Positive; signs of bottoming out and strong technical recovery support upside potential. |
| Healthcare | Rounding bottom on weekly; bullish piercing pattern on monthly signals reversal strength. | Buy near current levels with a stop-loss below 40500; aim for 44500–45500 targets. | Positive; index is showing early signs of trend reversal backed by strong price and momentum indicators. |
| Basic Material | Falling rectangle breakout confirmed on weekly chart; price structure remains positive. | Buy near current levels with stop-loss below 7200; aim for 7800–8000. | Positive; bullish structure and momentum suggest sustained upside potential. |
| FMCG | Falling wedge breakout on weekly; Doji candle on monthly suggests indecision but base building. | Buy near current levels with stop-loss below 19500; targets at 21500–22500. | Cautiously positive; technicals show early signs of reversal with potential for recovery. |
| Consumer Durables | Rounding bottom on weekly; spinning top on monthly suggests indecision with slight upward bias. | Buy near support zone with stop-loss below 54000; add on breakout above 61000 for further upside. | Moderately positive; trading range with bullish tilt supported by technical structure and improving momentum. |
| IT | Rising wedge pattern on monthly; Dragonfly Doji and bullish follow-up indicate potential bottoming. | Watch for breakout above 38500 to enter long; stop-loss below 35000 if already positioned. | Neutral-to-positive; reversal signs in place, but confirmation required through breakout for sustained upside. |
Nifty Realty Index
Strong bullish bias as long as index trades above 850.
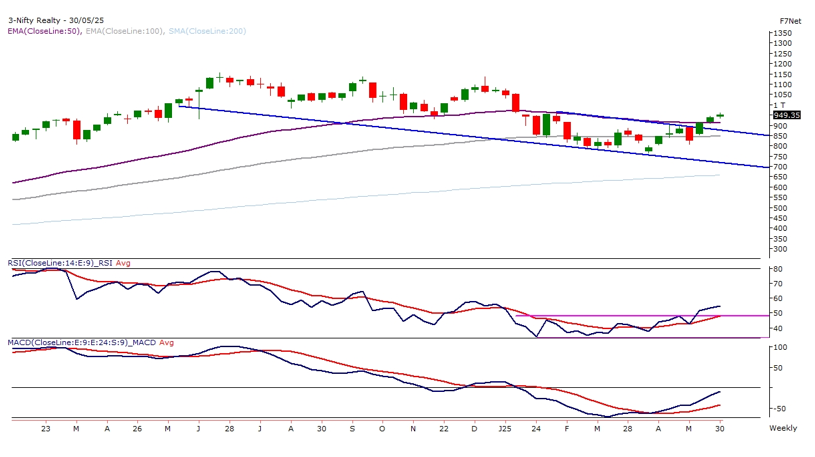
Trend Formation
On the monthly chart, this is the third consecutive bullish candlestick, with the latest candle showing a 7% gain, a long lower wick, and a close near the high, reflecting strong buying pressure at lower levels.
Weekly Analysis
On the weekly chart, the Nifty Realty Index has confirmed a breakout from a falling channel pattern, signaling the end of a corrective phase and beginning of a fresh upward leg.
Momentum Indicators
Though not explicitly provided, the structure implies RSI likely rising, possibly above 60–65, confirming bullish momentum. MACD crossover likely happened post-breakout.
- Support: 850-900
- Resistance: 1,050-1,150
- Sustained price action and follow-through could lead to 10–15% upside from current levels.
Nifty Auto Index
Bullish above 22000; a breakdown below this level may invalidate the bullish setup.
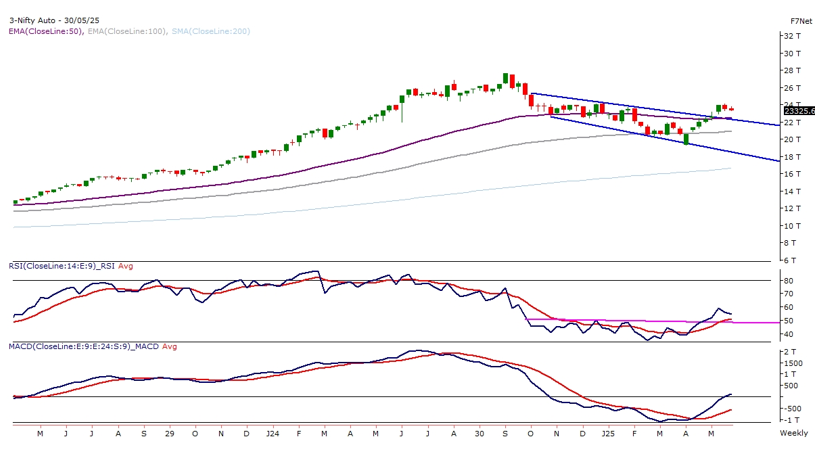
Trend Formation
Nifty Auto Index has broken out of a falling wedge on the weekly chart, indicating a bullish trend reversal.
Weekly Analysis
Strong close above the wedge pattern confirms the breakout; supported by bullish price action and sustained recovery.
Momentum Indicators
RSI (14) has broken above 50 with a bullish crossover, signaling improving momentum and trend strength.
- Support: 22,000
- Resistance: 24200 / 25000
- Bullish above 22000; a breakdown below this level may invalidate the bullish setup.