
📈Sectoral Technical Outlook (1/2)
| Index Name | Trend | Pattern/Formation | Strategy |
| Realty | Index on the weekly time frame is trading in a higher high higher low formation and every dip is utilized as a new buying opportunity | index is still trading above its 21 & 50 EMA as the recent run-up was very strong and fast | Partially long at current levels & will wait for a dip at 850 levels, with immediate support near 800 levels and the upside capped below 980 – 1020 levels. |
| Auto | Bullish breakout indicating a bullish trend | Index has moved above the upper band of the upper band of the rising channel pattern | Partially long at current levels and will wait for a dip till 20,000 levels, with immediate support near 19,200 levels and the upside capped below 21,800 – 22,000 levels. |
| Industrial | Post-breakout prices are sustaining above the upper band of the bullish pattern, indicating the strength of the bullish breakout. | Index has witnessed a breakout of a horizontal flag pattern | Partially long at current levels and will wait for a dip will 11,600 levels, with immediate support near 11,000 levels and the upside capped below 13,000 – 13,400 |
| Capital Goods | Index on the weekly chart is trading in a higher high higher low formation | Bullish flag pattern breakout | Go long for a higher level at 61,000 – 61,500 levels with immediate support at 54,500 – 54,000 levels. |
| Telecom | Continuation of the upward movement. | Bullish pennant patterns occur after an uptrend and indicate a potential continuation | Consider a long position at the current stage for a higher level in the range of 2,550 – 2,600 levels with immediate support at 2,400 – 2,350 levels |
| Bankex | Has formed consecutive bullish candles on the weekly chart. | Trading in a rising channel pattern | Consider going long at the current stage for a target at 54,800 – 55,300 levels, with immediate support at 51,800 – 51,000 levels |
📈Sectoral Technical Outlook (2/2)
| Index Name | Trend | Pattern/Formation | Strategy |
| Energy | Cautious as the momentum oscillator RSI (14) has reached near 90 levels | Trading in a higher high formation | Expecting the Energy Index to trade within the Range between 37,500 and 41,000 levels for the coming month with a bearish bias |
| Healthcare | Higher high higher low formation is well intact on the broader time frame | Formed a topping-out candle formation is shrink. | Index to trade within the Range between 34,000 and 36,500 levels for the coming month with a bearish to sideways bias. |
| Materials | Index has again resumed its journey towards the north | Index on the weekly time frame has given a triangle pattern breakout | Long at the current stage is advisable for a higher level at 6,800 – 6,850 levels with immediate support at 6,400 – 6,300 levels |
| FMCG | Higher high higher low formation is still intact on the broader time frame | Index on the weekly chart is trading in a rising channel pattern | a drift below 19,100 levels will initiate a bearish breakdown in the index and if prices can hold support near 19,500 levels we may see a reversal in the trend till 20,200 – 20,400 levels. |
| Consumer Durables | Index on the weekly time frame has given a triangle pattern breakout | Retested the breakout levels which calls for a breakout pullback pattern | partially long at current levels and will wait for a dip to 50,000 levels, with immediate support near 49,000 levels. On the higher side, the next target for the index stands near 53,000 – 53,500 levels |
| Information Technology | Continues to trade in a higher high higher low formation | Pennant pattern breakout on the weekly time frame | Initiate a half positional at current levels and another half at a dip near 37,000 levels with a downside protected at 36,500 – 36,000 levels and the upside capped below 38,700 – 39,000. |
Realty Index 🏡
Nifty Realty Index continues to move higher with all blazing guns
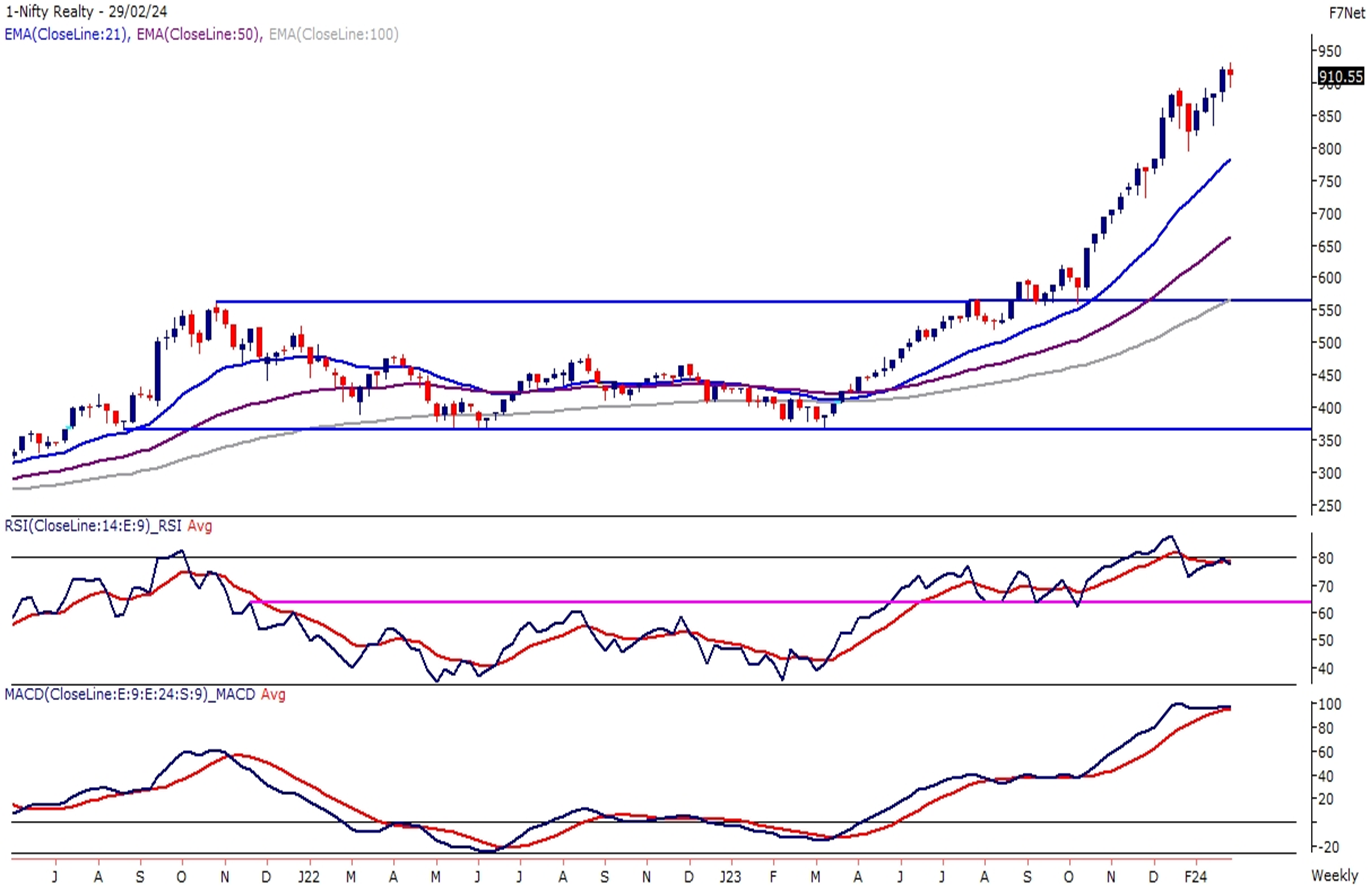
After witnessing a minor throwback, the Nifty Realty Index continues to move higher with all blazing guns and has smartly outperformed the Benchmark Index.
The Index on the weekly time frame is trading in a higher high higher low formation and every dip is utilized as a new buying opportunity in the Realty Index. The momentum oscillator RSI (14) has sustained above 60 levels post-consolidation breakout and has settled in a bullish range shift zone with a strong bullish bias. The index is still trading above its 21 & 50 EMA as the recent run-up was very strong and fast.
Consecutive 6 positive closings on the monthly chart suggest the possibility of a slowdown in the momentum but the bullish trend remains intact. We will be partially long at current levels and will wait for a dip will 850 levels, with immediate support near 800 levels and the upside capped below 980 – 1020 levels.
Auto Index 🚗
NIFTY AUTO Index continues to move higher with a strong bullish bias.
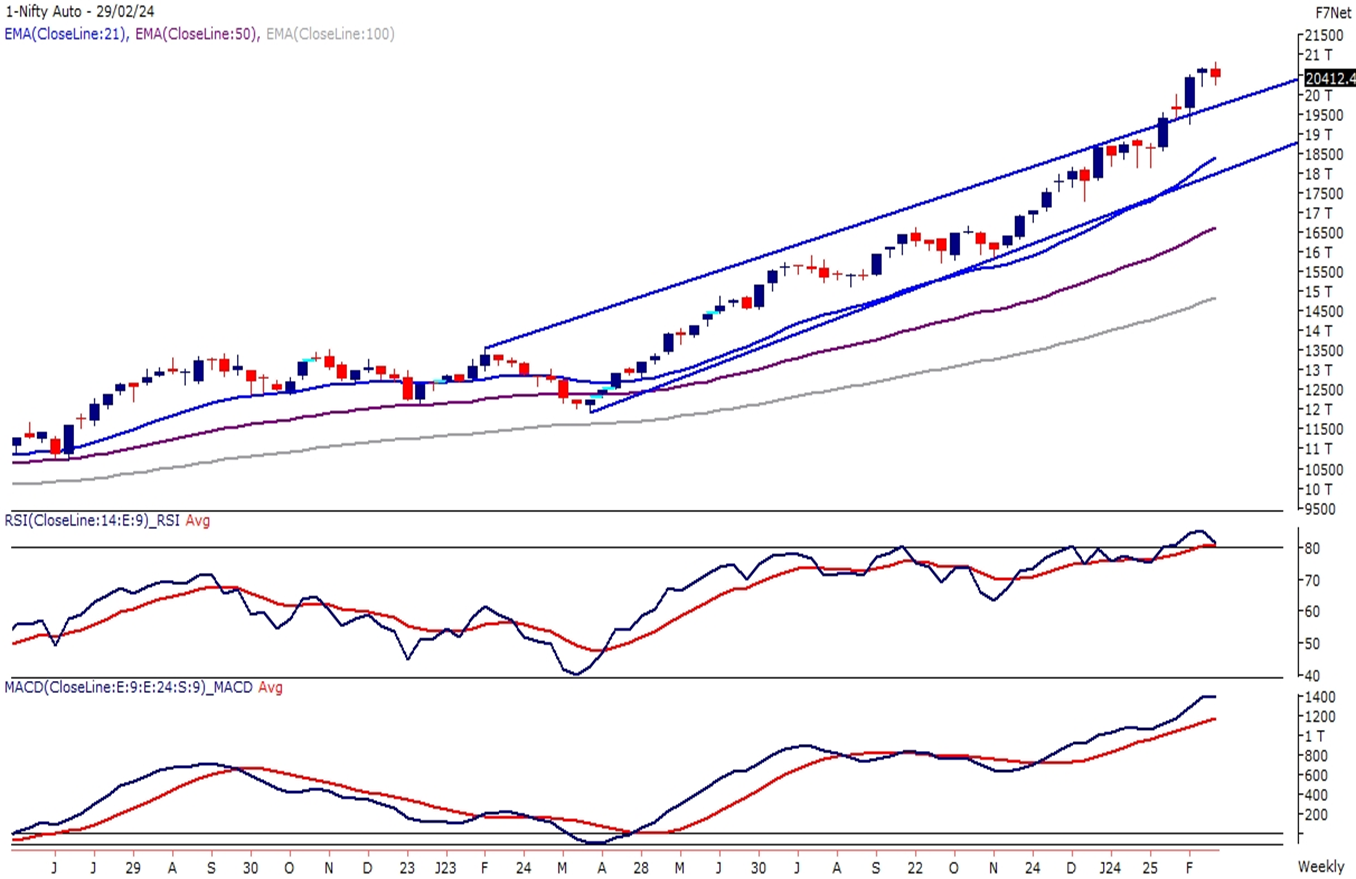
The Nifty Auto Index has moved above the upper band of the rising channel pattern and continues to move higher with a strong bullish bias. The Auto Index has outperformed the Benchmark index in recent times and the majority of Auto stocks have witnessed a bullish breakout indicating a bullish trend in the Index.
The momentum oscillator RSI (14) has witnessed an inverted head and shoulder pattern breakout above 80 levels on the weekly time frame. Generally, the RSI above 80 levels is considered an overbought but while considering the broader bullish trend a breakout in RSI calls for a strong bullish trend. An oscillator can remain overbought on a broader time frame for a long period if the underlying trend is very strong.
We will be partially long at current levels and will wait for a dip will 20,000 levels, with immediate support near 19,200 levels and the upside capped below 21,800 – 22,000 levels