
Realty
Highlights: Index has given a bullish falling channel pattern breakout
Source: BSE, Fisdom Research
4.8% returns for October 2023
The NIFTY REALTY INDEX witnessed a multiyear rectangle pattern breakout on the monthly time frame, and the index is advancing higher with all guns blazing. The Realty index has been trading in higher highs for the past six months, indicating strength in the breakout.
On the weekly chart, the index formed a bullish hammer candlestick pattern near its throwback levels and moved higher afterward. The index is currently trading above its 21, 50, and 100 WEMA, and the momentum oscillator RSI (14) is reading above its trendline support with a bullish range shift on the weekly scale.
Buying on dips will be an effective strategy after a bullish breakout, as the index is expected to experience a throwback in the broader time trend. One should initiate a half position at current levels and another half at a dip near 620 levels, with downside protection at 600 levels and the upside capped below 670 – 690 levels
FMCG
Highlights: Index on the weekly chart is trading in a higher high higher bottom formation
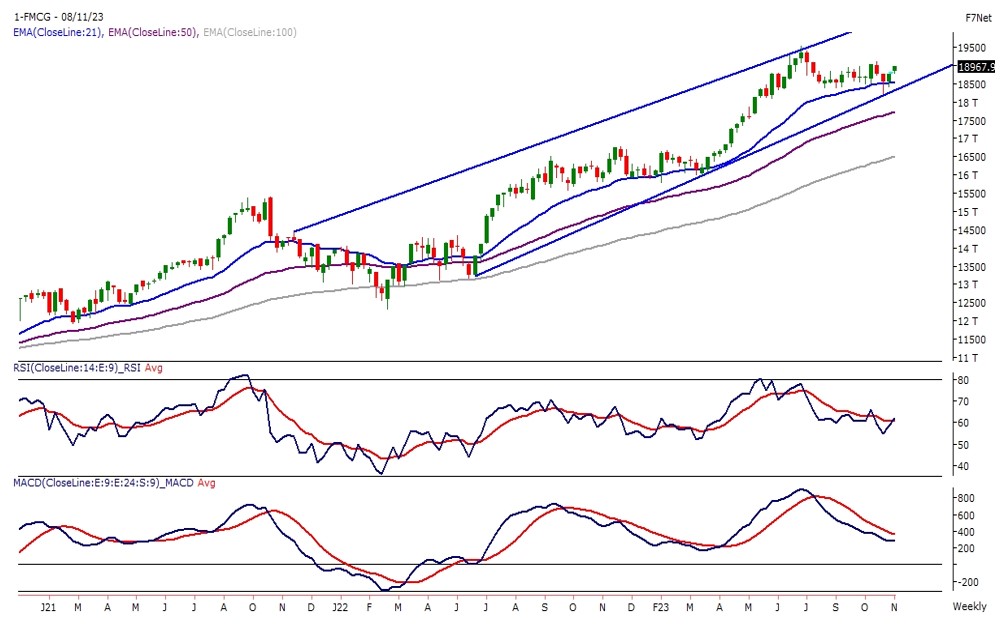
Source: BSE, Fisdom Research
-0.7% returns for October 2023
The FMCG Index on the weekly chart is trading in a higher high, higher bottom formation within a rising channel pattern. Recently, the FMCG index has found support near its 21 WEMA, which is positioned at 18,550 levels. In terms of candlestick prices, it has also formed a bullish hammer pattern near its 21 EMA
The momentum oscillator RSI (14), after forming a negative divergence near 80 levels, has moved lower and is presently hovering near 60 levels. Based on the above technical study, we expect prices to trade within the range of 18,400 – 19,200 levels with a bullish bias
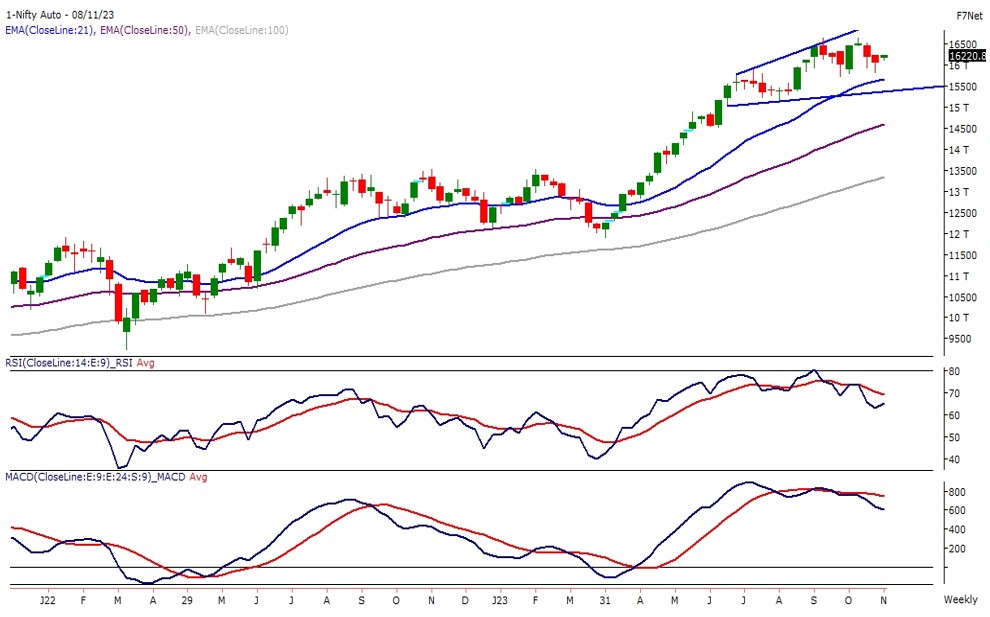
Auto
Highlights: Index has been trading around the 16,000 level for the last couple of months

Source: BSE, Fisdom Research
-1.7% returns for October 2023
The NIFTY AUTO INDEX has been trading around the 16,000 level for the last couple of months and has formed a broadening triangle pattern on the weekly time frame. The prices are nicely positioned above its 21 EMA, which is acting as an anchor point for the index.
The momentum oscillator RSI (14) is hovering within the 80 – 65 range, suggesting a sideways trend with a hint of bearishness The MACD indicator has turned flat but is reading above its polarity line.
The index is expected to trade within the range of 15,550 – 16,750 levels in the coming month with a bullish bias Major breakouts or breakdowns will be triggered only above the said levels.
Industrial
Highlights: The index is consolidating within the 1,000 points from the past couple of months and has formed a rectangle pattern
Source: BSE, Fisdom Research
-3.2% returns for October 2023
The INDUSTRIAL Index witnessed a breakout above the rising channel pattern and traded in a higher high higher bottom formation on the weekly time frame. On the weekly chart, the index is consolidating within the 1,000 points from the past couple of months and has formed a rectangle pattern.
The momentum oscillator RSI (14) has drifted lower from the overbought levels and presently hovering near 70 levels. The trend of the indicator suggests prices are likely to be in a cool-off phase. The 21 EMA is closely following the prices and is likely to act as an immediate anchor point for the prices.
The index is expected to trade within the range of 9,400 – 10,450 levels in the coming month with a bullish bias. Major breakouts will be above 10,450 levels of a rectangle pattern on the weekly time frame.