Utilities
Highlights: Index has retested its breakout levels and seems to have completed the throwback of the pattern
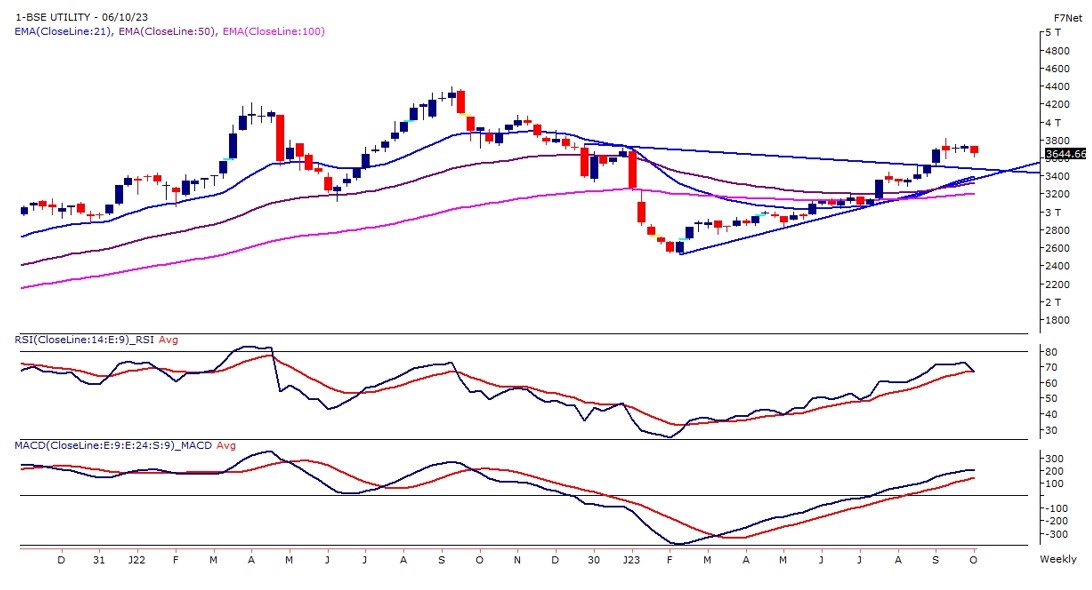
9.2% returns for September 2023
The BASIC UTILITIES Index on weekly time has witnessed a consolidated triangle pattern breakout after a brief consolidation. The recent profit booking index has retested its breakout levels and seems to have completed the throwback of the pattern.
The UTILITIES Index is trending above the golden cross on the weekly chart. Technically, the bullish crossover of 21EMA over 50EMA & 100EMA is known as the ‘golden cross’ – the short to medium-term bullish trend.
On the lower panel momentum, oscillator RSI (14) is moving in a higher high higher bottom formation with a bullish crossover on the cards. The MACD indicator has moved above its line of polarity with a bullish crossover.
Technically UTILITIES Index is trading in a bullish terrain and buying on present levels can be initiated with immediate support of 3,550 – 3,500 levels and on the higher side 3,850 – 4,000 are likely to be seen in the index..
Industrial
Highlights: The index recently witnessed a breakout of a rising channel pattern which confirms the strong bullish strength in the Industrial Index
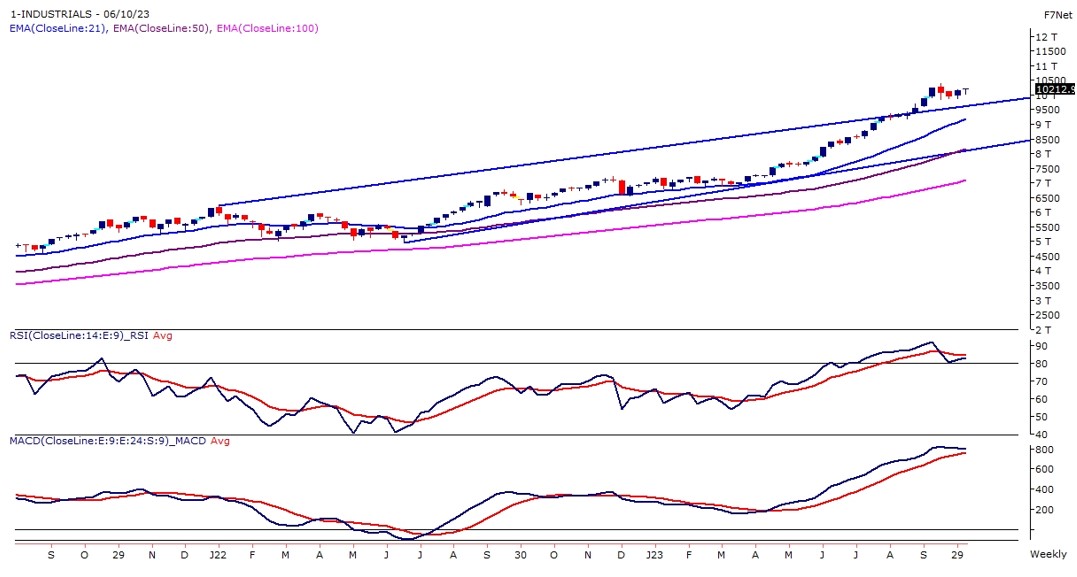
3.4% returns for September 2023
- The INDUSTRIAL Index trades within the rising channel pattern in a higher high higher bottom formation on the weekly time frame. The prices have recently witnessed a breakout of a rising channel pattern which confirms the strong bullish strength in the Industrial Index.
- In the last couple of weeks, the index was seen to be consolidating in a very narrow range but a major profit booking was missing indicating a strong bullish trend in the Industrial Index. The momentum oscillator RSI (14) is reading in a higher high higher bottom formation and is hovering near the 85 – 75 range.
- As the index has already witnessed a strong rally one should initiate a half positional at current levels and another half at a dip near 9,800 levels with a downside protected at 9,500 levels and the upside capped below 11,000 levels.
Realty
Highlights: INDEX witnessed a rectangle pattern breakout in the second week of September
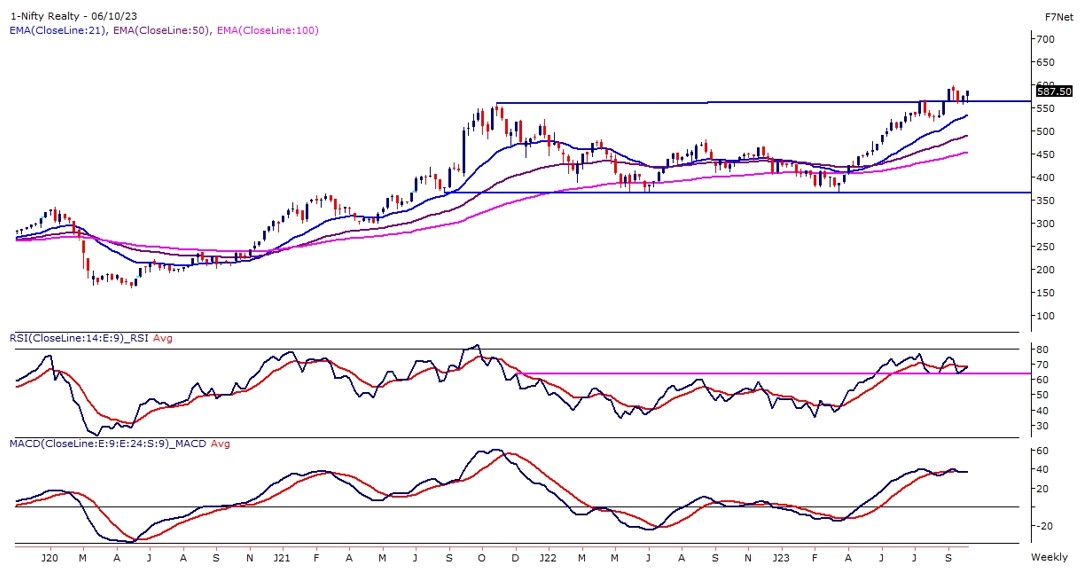
3.1% returns for September 2023
NIFTY REALTY INDEX witnessed a rectangle pattern breakout in the second week of September and after that, the index went to a throwback mode and retested its breakout levels on the weekly time frame.
Now the Realty index has formed a bullish harami candle stick pattern near its trend line support and index and moved higher above the high of the bullish pattern indicating the validity of the said candle stick pattern.
The index is trading above its 21, 50, and 100 WEMA, and the momentum oscillator RSI (14) is reading above its trend line support with a bullish range shift mode. A convincing move above 600 levels will initiate a fresh buying spurt in the Realty Index, which may reach 635 – 650 levels. The immediate support of the index stands at 560 – 545 levels.
Capital Goods
Highlights: Index has recently witnessed a breakout of a rising channel pattern which confirms the strong bullish strength in the Industrial Index
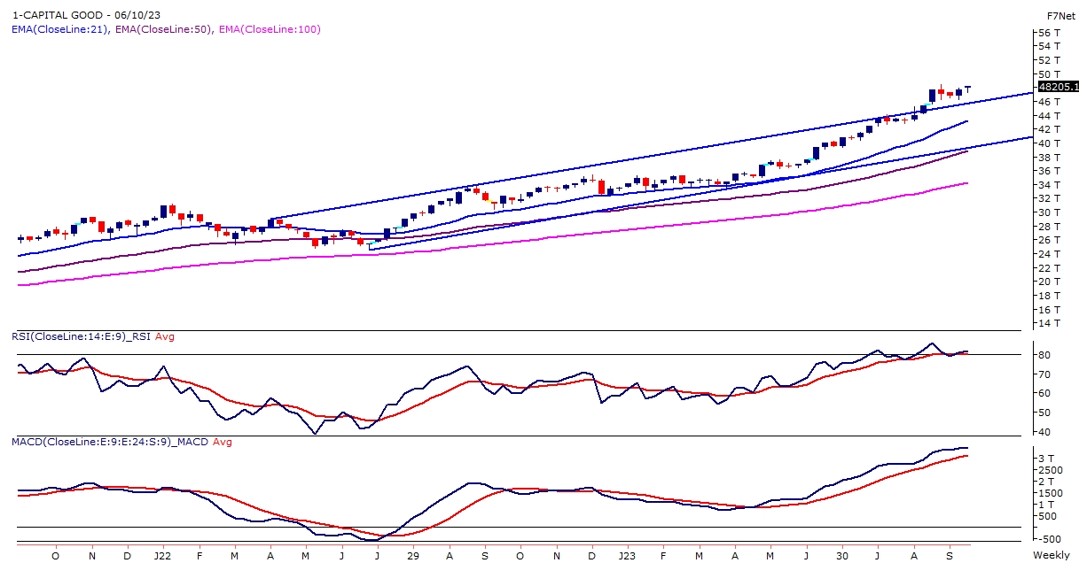
5.6% returns for September 2023
The CAPITAL GOODS Index has given more than 15 Percent returns in the past 4 months and continues to trade in a higher high higher bottom formation. The prices have recently witnessed a breakout of a rising channel pattern which confirms the strong bullish strength in the Industrial Index.
In the last couple of weeks, the index was seen to be consolidating in a very narrow range but a major profit booking was missing indicating a strong bullish trend in the Capital Goods Index. The momentum oscillator RSI (14) is reading in a higher high higher bottom formation and is hovering near the 85 – 75 range with a bullish range shift mode.
As the index has already witnessed a strong rally one should initiate a half positional at current levels and another half at a dip near 47,200 levels with a downside protected at 45,500 levels and the upside capped below 51,000 levels.
Source: BSE, Fisdom Research