
Key Highlights
Calendar Year Volatility Assessment:
Each year is susceptible to dynamic fluctuations driven by a confluence of global and domestic risks, affecting all market participants indiscriminately.
Duration of Market Downturn:
On average, the market experiences a downturn lasting approximately 4 to 5 months within the year, constituting a significant period of economic uncertainty.
A Decade of Volatility and Triumph:
Over the past ten years, despite more than 50% of trading days experiencing negative returns, the stock market concluded positively in all years except one, highlighting a remarkable resilience to short-term volatility.
Strategic Investment Augmentation:
Investors who strategically increased their Systematic Investment Plans (SIPs) by 20% during market contractions realized a substantial 869% in excess gains, surpassing the returns generated from their additional investment.
Informed Investment During Contractions:
Those investors who chose to remain invested during market downturns experienced returns that were 16 percentage points higher in 2023 and 28 percentage points higher in 2020 compared to their counterparts who redeemed their investments and reinvested in safer assets. This underscores the value of informed and steadfast investment strategies during challenging market phases.
Path To Crorepati
An Rs. 10 lakh lumpsum investment in the Year 2000 has surged to ~Rs. 1.6 crore by 2023.
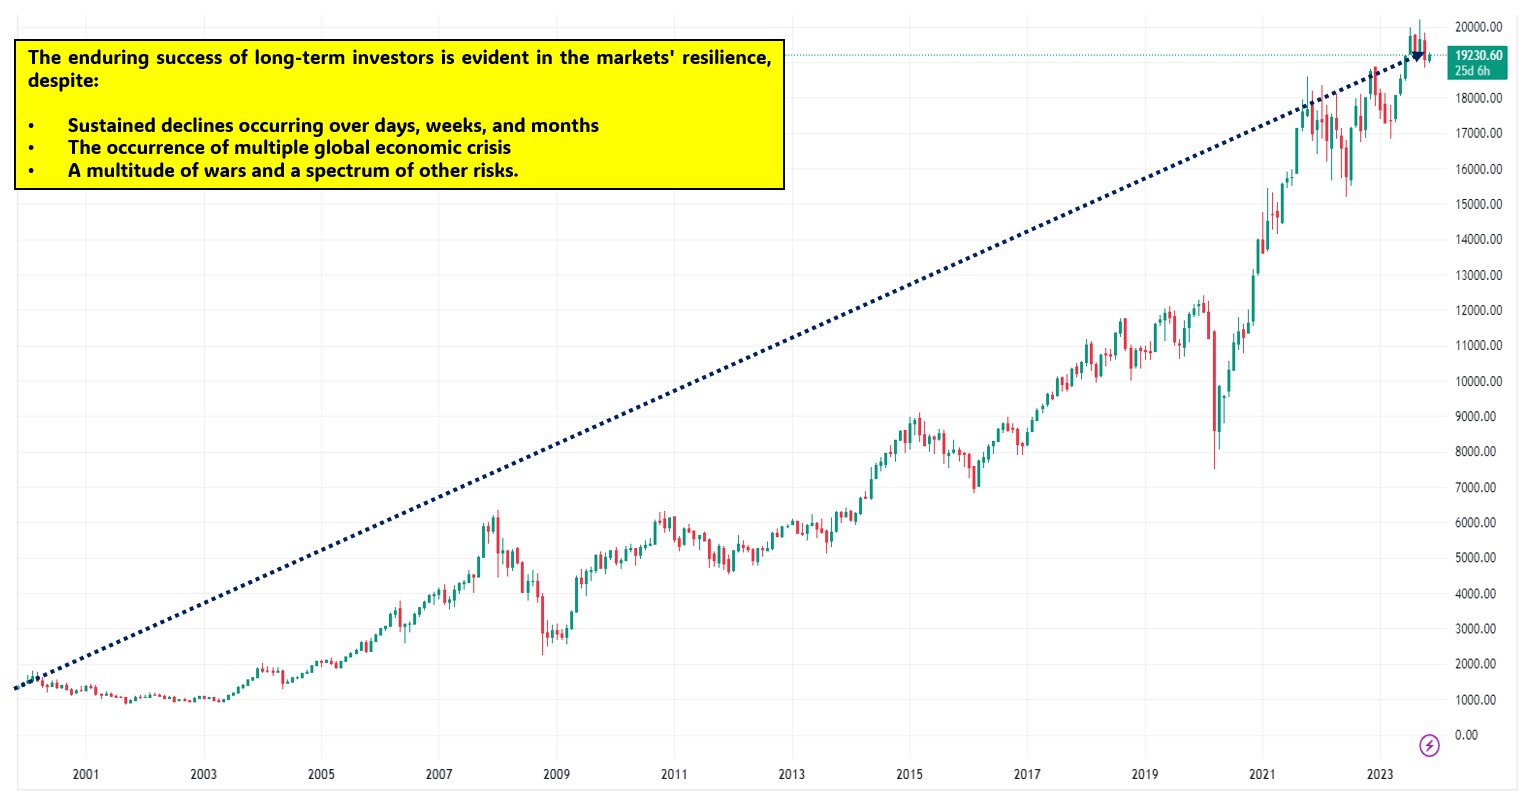
Market Wins Every Year
Navigating Positivity Amidst Annual Volatility
| Calendar Year | Maximum Drawdown | Maximum Gain | CY Returns (%) | % of Negative days | Lowest Daily Returns |
| CY2023 | -7.00% | 12.10% | 5.80% | 44% | -1.60% |
| CY2022 | -16.20% | 10.70% | 5.70% | 50% | -4.70% |
| CY2021 | -10.20% | 29.80% | 25.50% | 44% | -3.70% |
| CY2020 | -45.80% | 19.90% | 16.10% | 41% | -12.90% |
| CY2019 | -11.10% | 14.30% | 13.40% | 47% | -2.10% |
| CY2018 | -15.30% | 12.30% | 4.60% | 46% | -2.60% |
| CY2017 | -4.10% | 26.80% | 30.20% | 47% | -1.50% |
| CY2016 | -12.90% | 13.90% | 4.30% | 47% | -3.30% |
| CY2015 | -15.70% | 8.60% | -3.00% | 50% | -5.90% |
| CY2014 | -6.60% | 32.70% | 32.80% | 41% | -2.10% |
- Over the past ten years, in each calendar year, the stock market experienced at least 50% of its trading days with negative returns.
- Strikingly, despite this high occurrence of negative days, the market concluded positively in all years except one.
Investing Through Market Fall
Unlocking Insights
Calendar Year: 2023
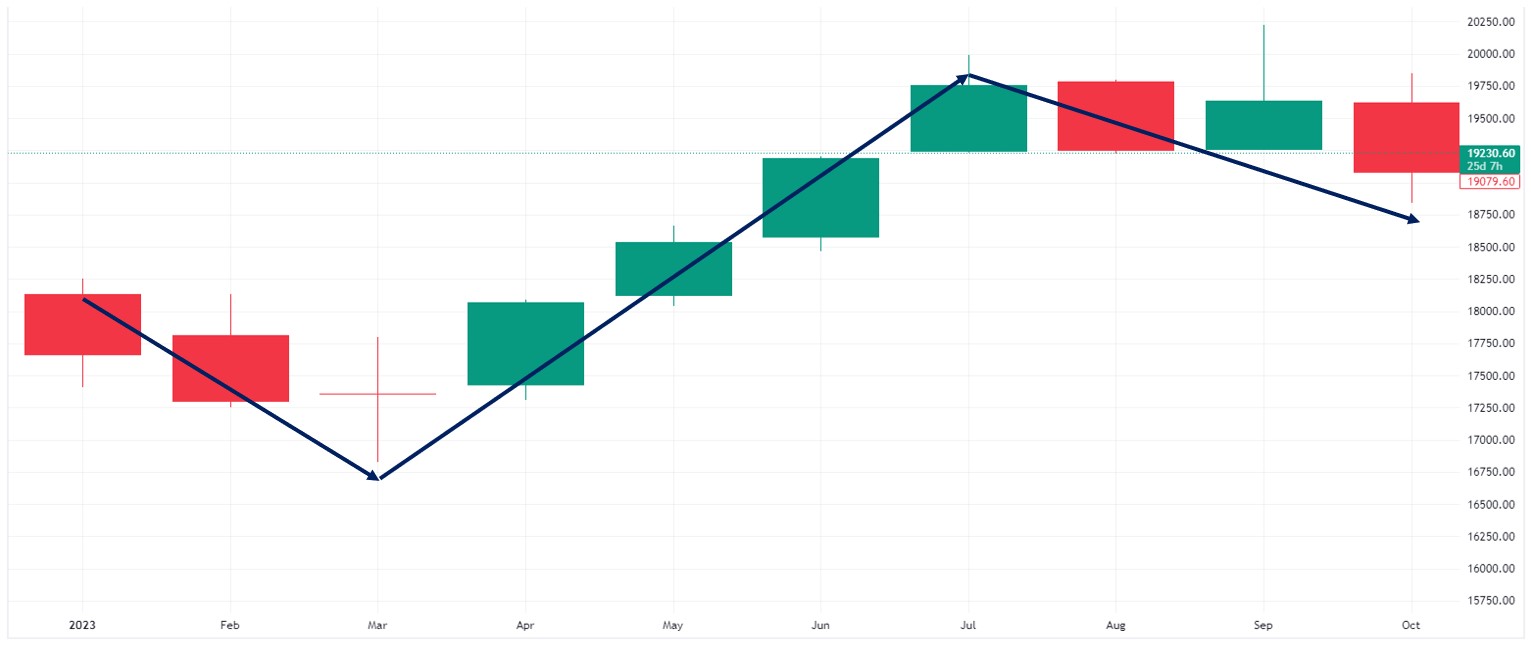
| Period | 01st January 2023 – 31st October 2023 |
| Negative Month Counts | 5 of 12 |
| Returns During The Year | 5.88% |
| Maximum Drawdown | -7.17% |
Source: ACE MF, TradingView, Fisdom Research.
Calendar Year: 2022
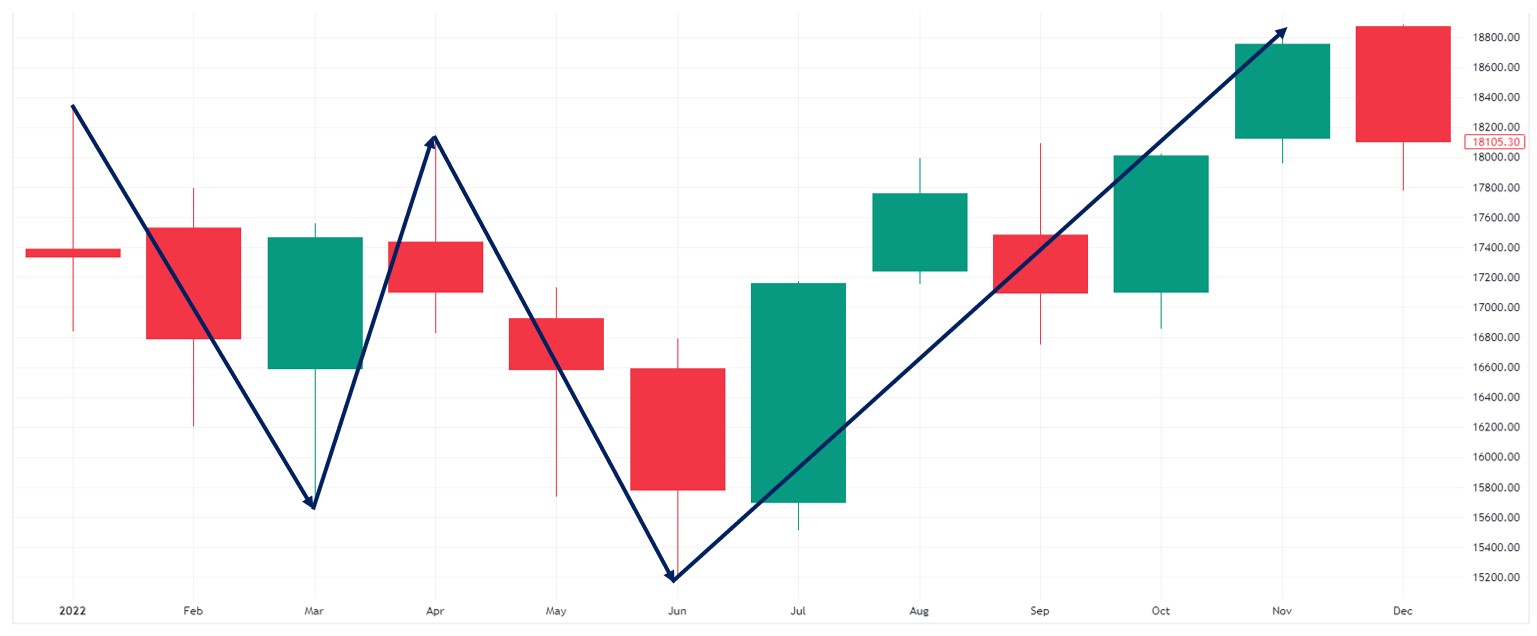
| Period | 01st January 2022 – 31st October 2022 |
| Negative Month Counts | 7 of 12 |
| Returns During The Year | 5.69% |
| Maximum Drawdown | -17.02% |
Source: ACE MF, TradingView, Fisdom Research.
Calendar Year: 2021
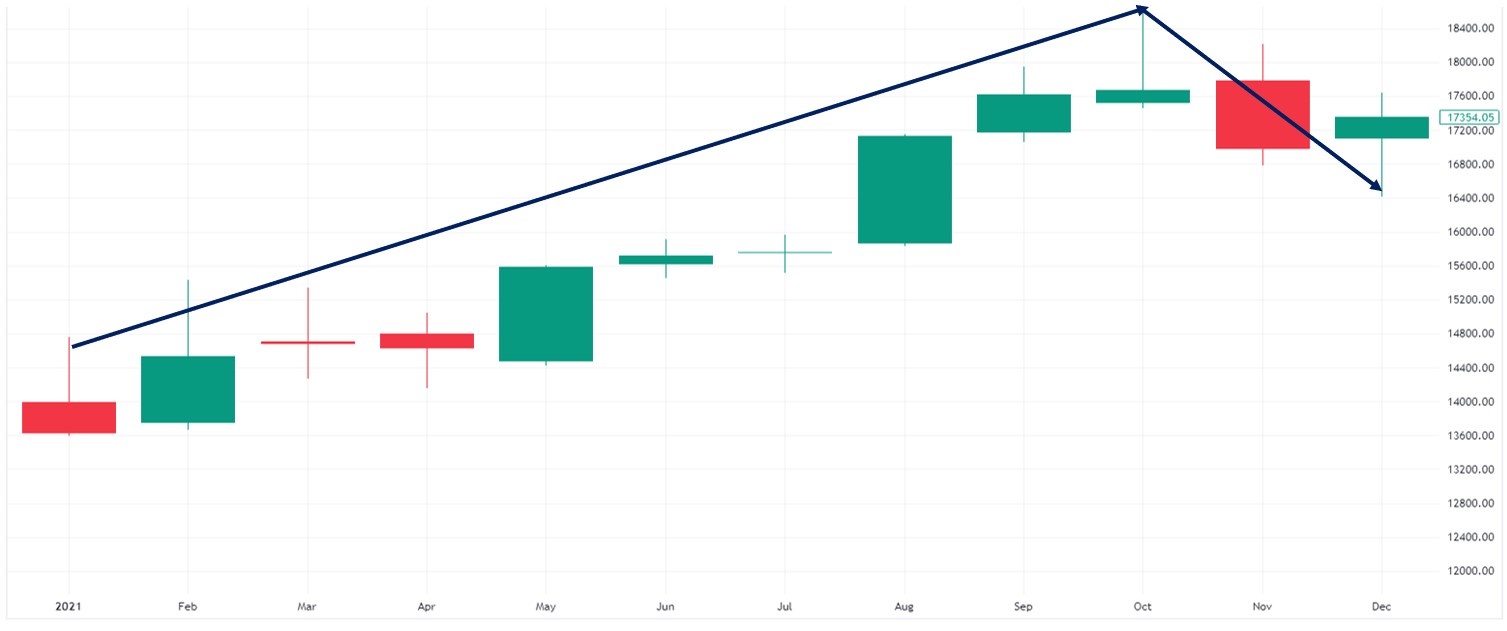
| Period | 01st January 2021 – 31st October 2021 |
| Negative Month Counts | 4 of 12 |
| Returns During The Year | 25.59% |
| Maximum Drawdown | -10.38% |
Source: ACE MF, TradingView, Fisdom Research.
Calendar Year: 2020
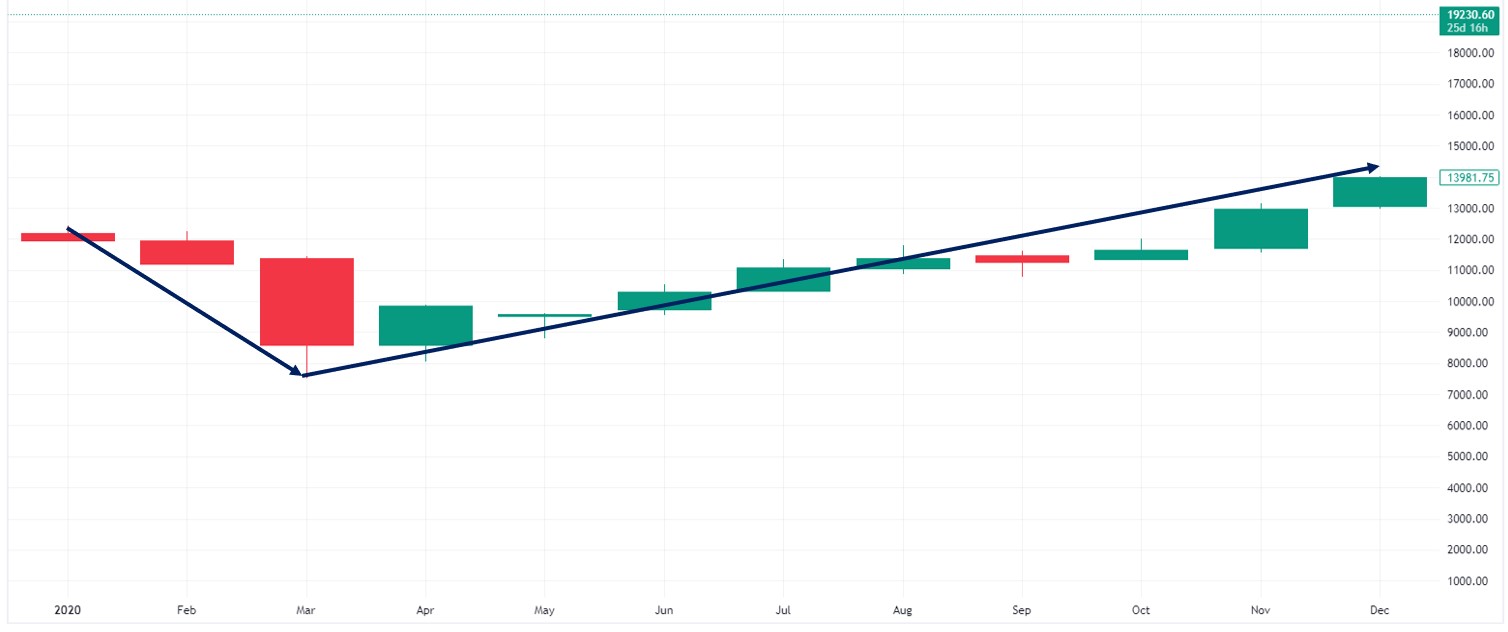
| Period | 01st January 2020 – 31st October 2020 |
| Negative Month Counts | 3 of 12 |
| Returns During The Year | 16.13% |
| Maximum Drawdown | -46.08% |
Source: ACE MF, TradingView, Fisdom Research.