
Technical Overview – Nifty 50
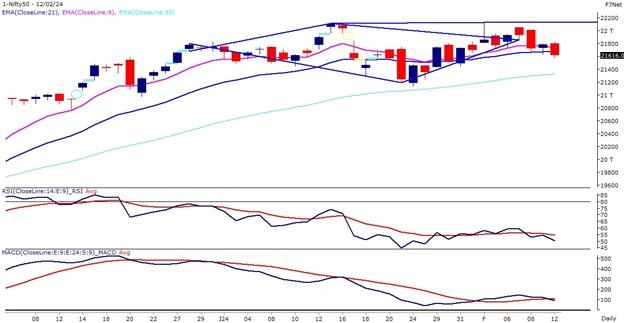
The Benchmark index started the fresh week with a bearish note where prices opened flat and continued to trade lower throughout the day and formed a bearish candle. In the previous week, the Index formed a spinning top candle stick pattern which indicates a sideways range for the index.
Strictly speaking, it has been an unusually narrow 7-trading week at Dalal Street as the great bulk of the market has been languishing and not participating in any euphoric action. The Nifty50 has presently given a diamond pattern breakdown and the index is trading below the convex point of the pattern.
The fear of missing out is itself missing, and chasing strength is not working. Nifty’s technical picture shifts from bearish to neutral amidst range-bound technical conditions on the daily charts with the biggest hurdles at the Nifty 22,000 – 21,500 mark.
Technical Overview – Bank Nifty
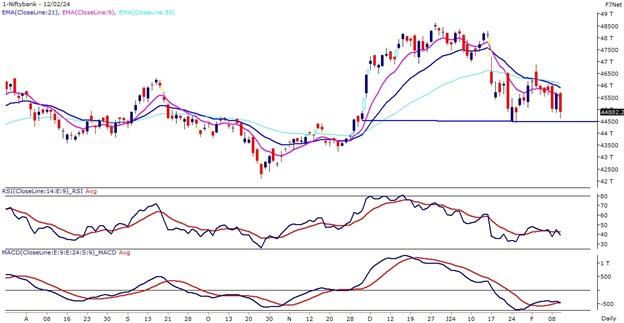
The Bank Nifty vanished all its previous day’s gain and formed a tall red candle indicating a bears are on the driving sheet. The Banking index started the fresh week with a bearish note where prices opened flat and continued to trade lower throughout the day and formed a bearish candle.
The Banking Index continued to trade below its 9, 21, and 50 EMA on the daily chart, and the shortest EMA slopped lower. Strictly speaking, volatility is the major concern for the traders which keeps traders on their toes. The Bank Nifty on the weekly chart is trading near the lower band of the rising wedge pattern which was acting as a crucial support for the index.
The immediate support for the Bank Nifty is placed near 44,400 levels a breakdown below these levels will drift prices to 44,000. The upper band is capped near 45,800 levels, a convincing move above the same will trigger more buying to 46,200 levels.
Indian markets:
- The Indian market opened slightly higher but struggled to sustain gains as selling pressure intensified throughout the session.
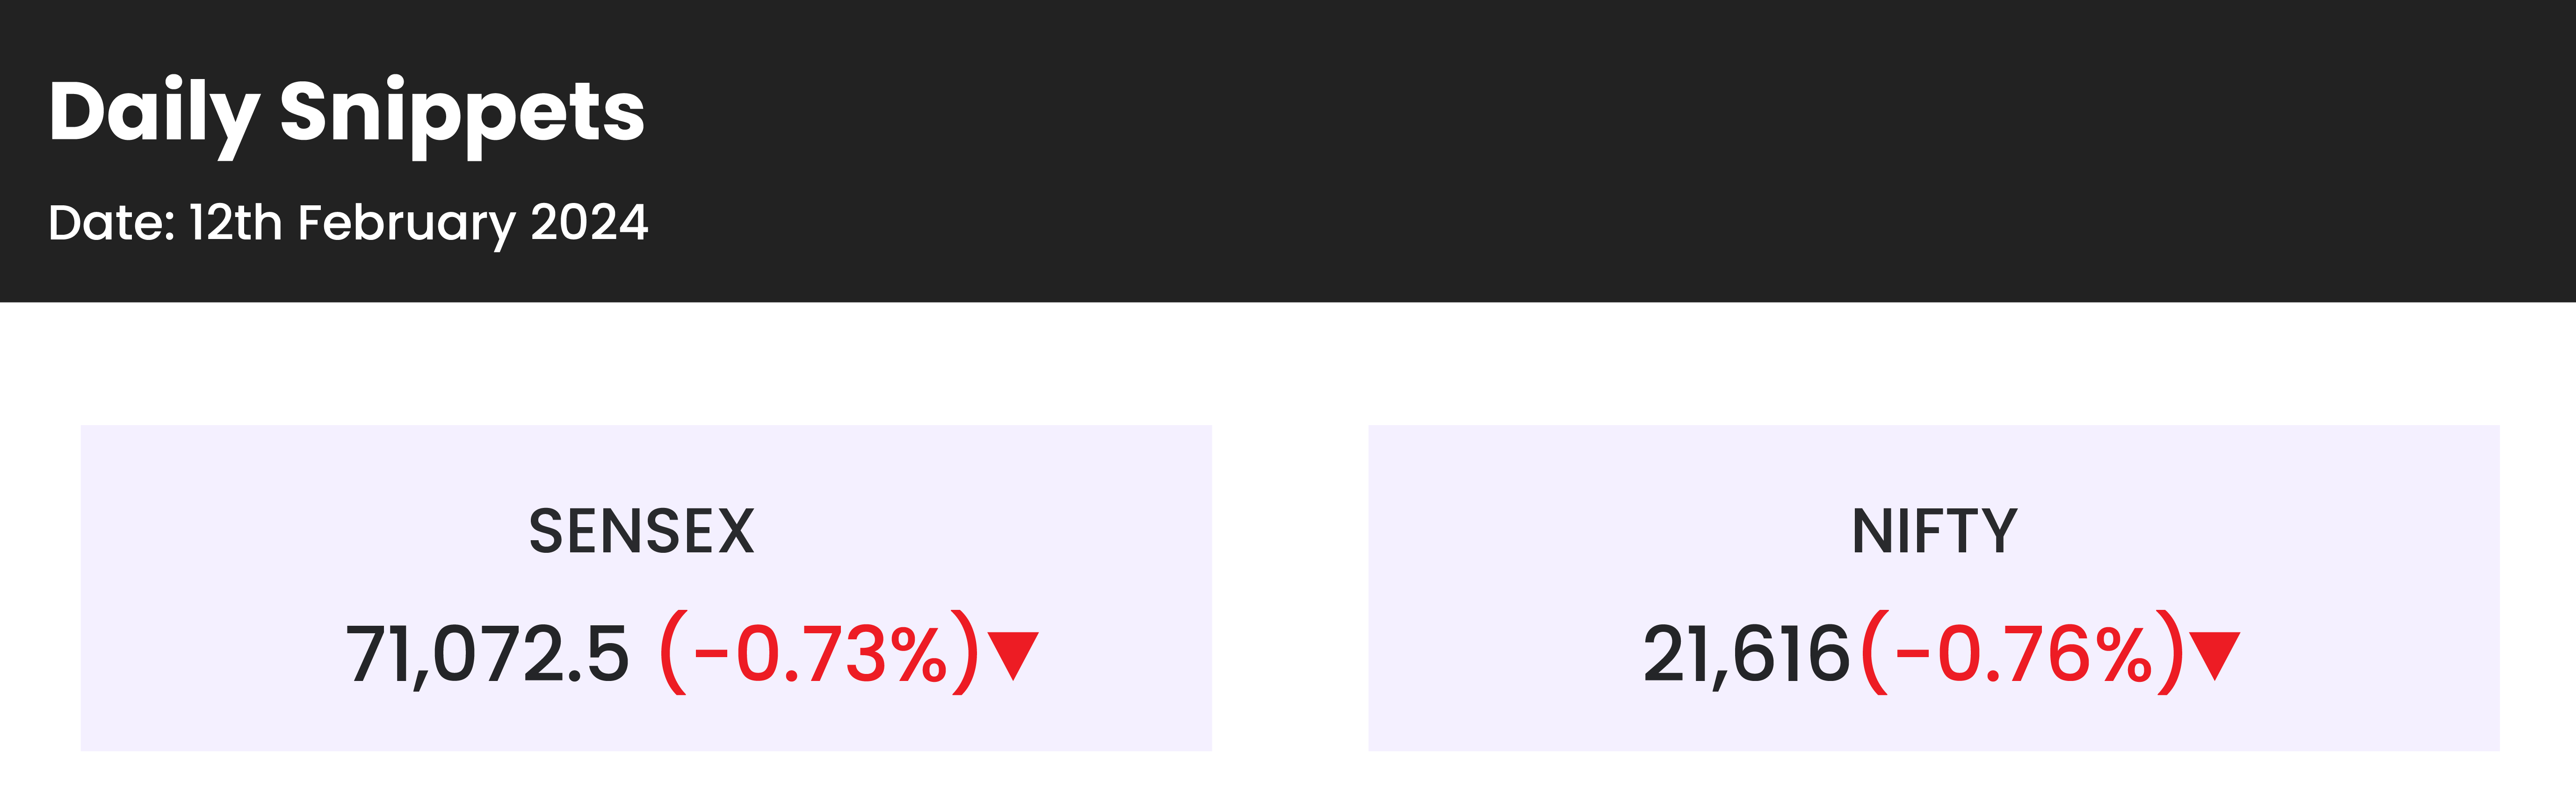
- Both the Sensex and the Nifty ended near the day’s low, indicating a lack of bullish momentum.
- Investor sentiment was cautious ahead of the announcement of CPI inflation data.
- Across sectors, FMCG, PSU banks, capital goods, metals, oil & gas, power, and realty witnessed declines ranging from 1 to 4 percent each.
- In contrast, healthcare and IT sectors managed to close in positive territory.
- Overall, the market exhibited weakness, with broad-based selling leading to losses in several sectors.
Global Markets:
- Oil prices experienced a decline on Monday, prompted by profit-taking activities among investors.
- Last week, both benchmarks saw a rise of approximately 6%, driven by tensions in the Middle East and refining outages impacting refined products markets.
- Brent crude futures fell by 89 cents, representing a decrease of about 1.1%, settling at $81.30 per barrel.
- Similarly, U.S. West Texas Intermediate crude futures slipped by 83 cents, also about 1.1%, closing at $76.01 per barrel.
- Market attention is now turning to upcoming economic data releases, with U.S. inflation data expected on Tuesday, and British inflation data and euro zone GDP anticipated on Wednesday.
Stocks in Spotlight
- PSU stocks experienced significant declines across various segments, particularly in the railway sector, where most PSU railway stocks traded below the year’s high. The BSE PSU Index, which had shown a strong year-to-date gain of over 12 percent, witnessed a notable drop of 4 percent on February 12, closing at 17,568. This decline can be attributed to multiple factors, including earnings below estimates and a subdued market reaction following the February 1 Interim Budget announcement. Despite a 5 percent increase in railway capital expenditure outlined in the budget, the segment has remained under pressure, reflecting broader market concerns and sentiments.
- Top of Form
- In the last three sessions, several stocks witnessed significant wealth erosion in terms of market capitalization. Leading the pack were Life Insurance Corp of India and Indian Railway Finance Co, each losing approximately Rs 41,000 crore. They were closely followed by Indian Oil Corp Ltd and NHPC, shedding about Rs 25,000 crore each. Additionally, NTPC Ltd and ONGC saw declines of approximately Rs 20,500 crore each. Other notable losses included SBI Cards and Payments and Indian Overseas, down by Rs 20,000 crore and Rs 19,000 crore, respectively. General Insurance Corp and Coal India faced declines of Rs 17,000 crore each, while SBI, REC, and PFC Ltd recorded losses of Rs 16,900 crore, Rs 16,800 crore, and Rs 15,500 crore, respectively.
- Pune-based leading forging firm Bharat Forge Ltd reported a remarkable surge of over 220 percent in year-on-year consolidated net profit for the December quarter of 2023, attributed to increased revenues. The consolidated net profit for the quarter stood at Rs 254.45 crore, marking a substantial rise of 223 percent compared to Rs 78.71 crore reported in the same period last year. Revenue also experienced a notable uptick, climbing by 15.7 percent to Rs 3922.96 crore from Rs 3389.95 crore recorded a year ago. The company’s defence business played a significant role in boosting revenues, while sectors such as Oil & Gas and Agri witnessed a decline in performance compared to the previous year.
- Top of Form
News from the IPO world 🌐
- Aplex Solar IPO closes with over 320 times subscription
- Apeejay Surrendra Park Hotel stock lists at nearly 21% premium
- Exicom Tele Systems may launch IPO by Feb end
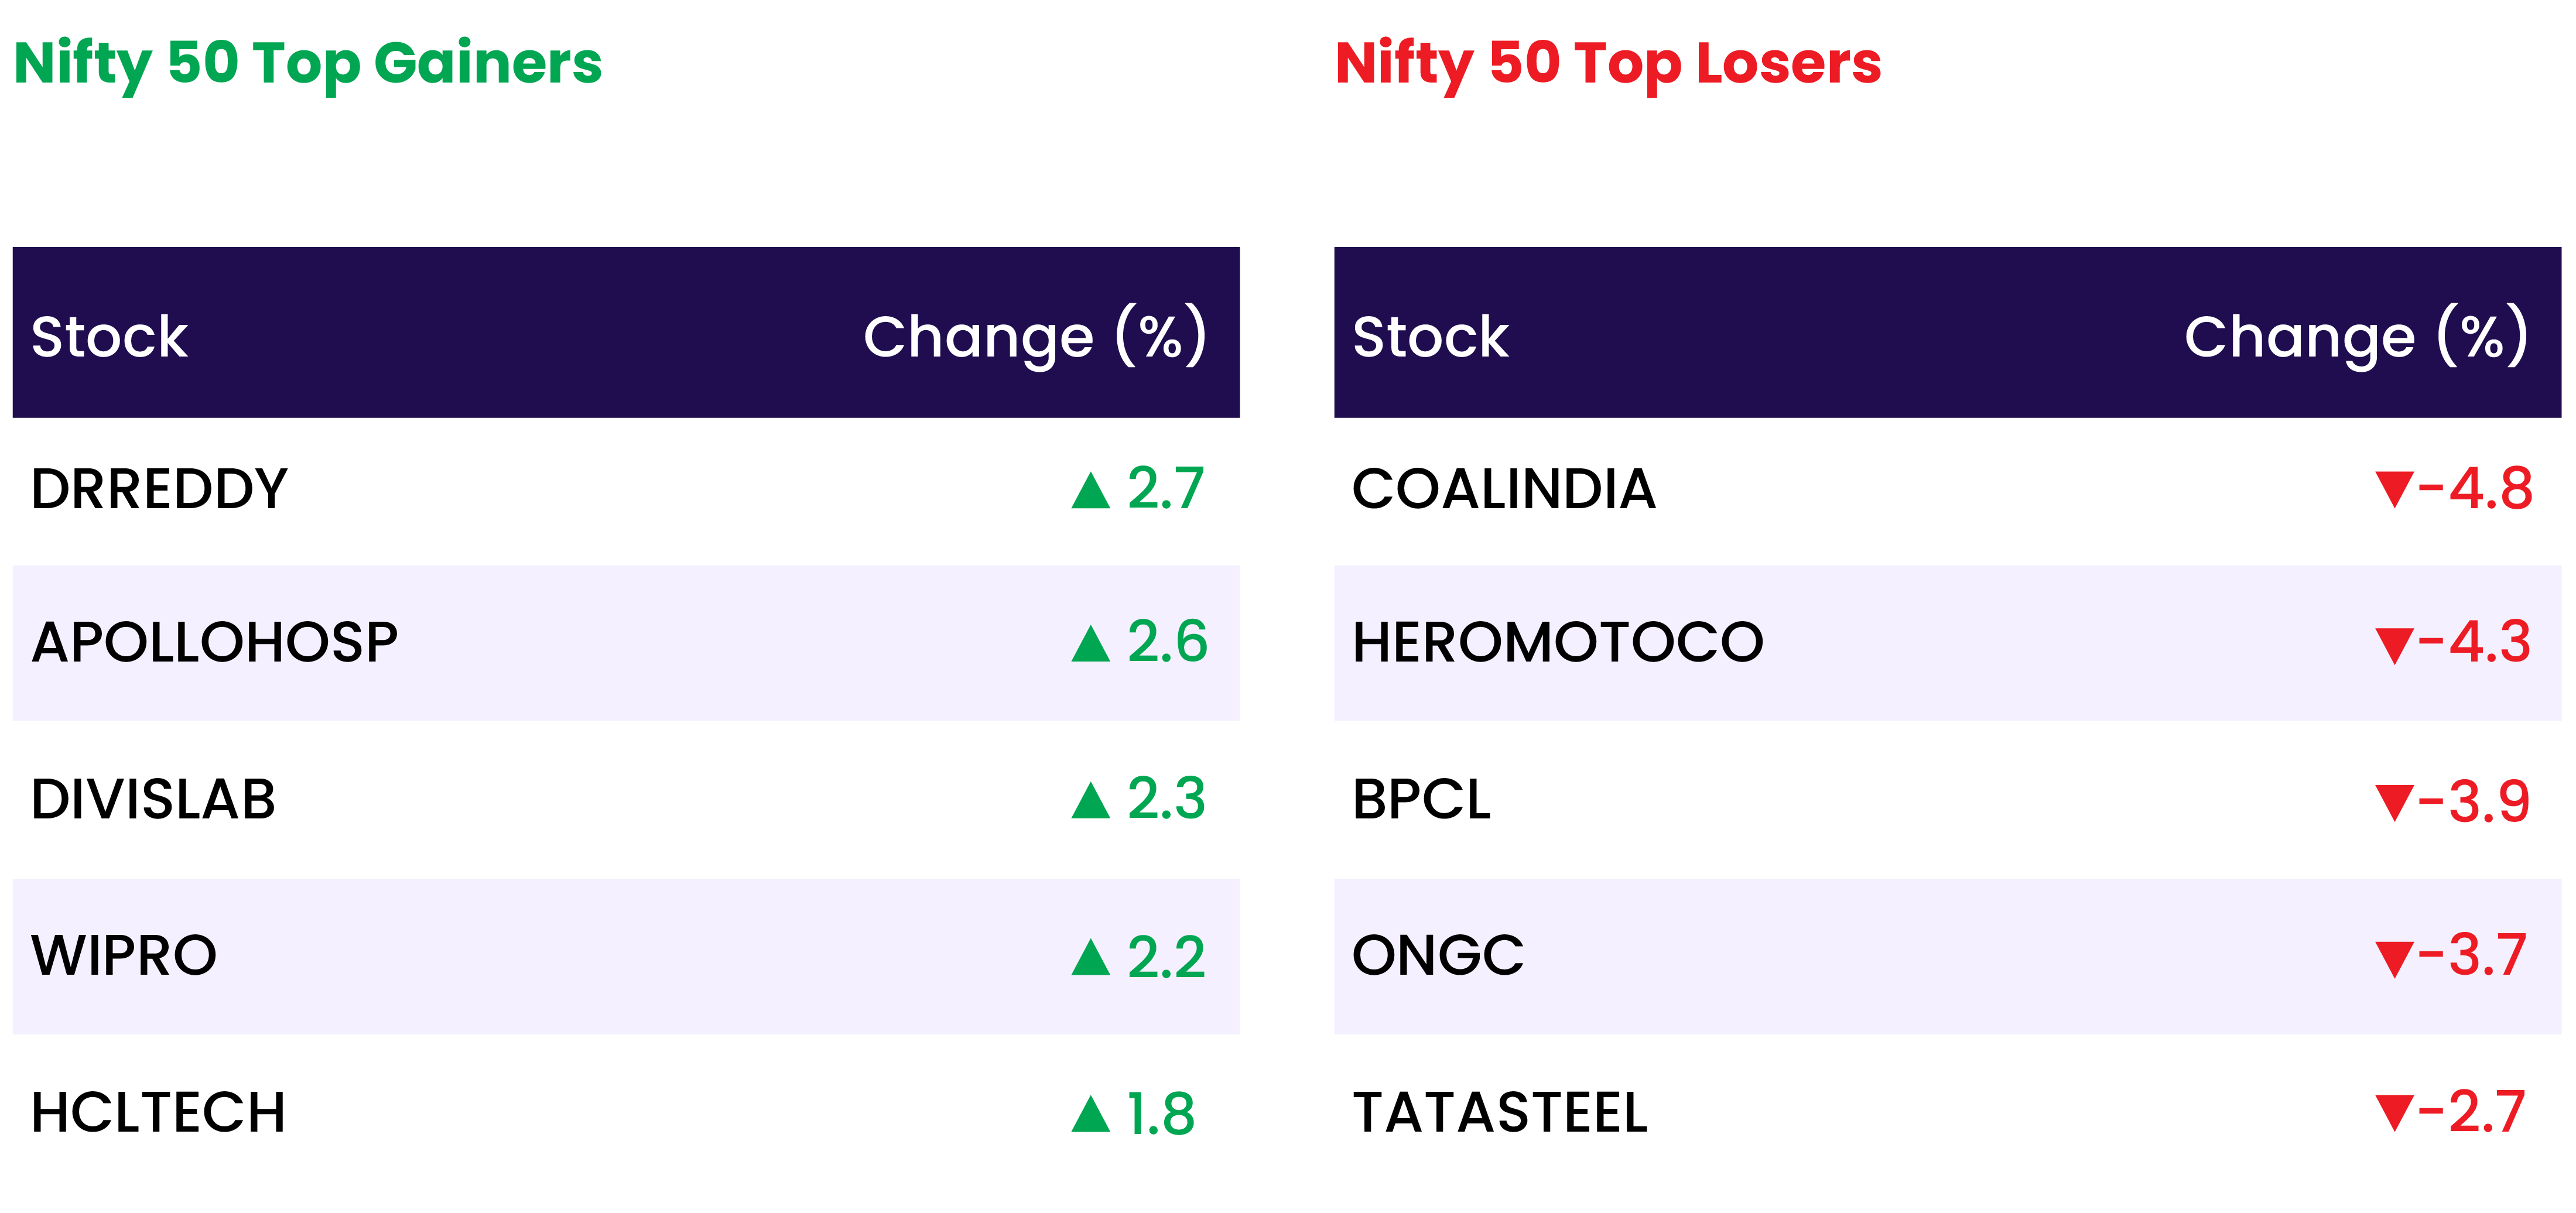
Daily Leader board:
Sectoral Performance
| Top Sectors | Day change (%) |
| NIFTY IT | 0.79 |
| NIFTY HEALTHCARE INDEX | 0.54 |
| NIFTY PHARMA | 0.28 |
| NIFTY AUTO | -0.80 |
| NIFTY CONSUMER DURABLES | -0.88 |
Advance Decline Ratio
| Advance/Declines | Day change (%) |
| Advances | 980 |
| Decline | 3015 |
| Unchanged | 84 |
Numbers to track
| Indices Name | Latest | % 1D | % YTD |
| Dow Jones (US) | 38,672 | (0.1) % | 2.5 % |
| 10 Year Gsec India | 7.1 | (0.2) % | (0.9) % |
| WTI Crude (USD/bbl) | 76 | 3.2 % | 8.3 % |
| Gold (INR/10g) | 62,105 | (0.2) % | 0.2 % |
| USD/INR | 83.98 | (0.0) % | (0.1) % |
Please visit www.fisdom.com for a standard disclaimer