In an ideal world, investments would move in a smooth path in an upward direction, perfectly in line with the market conditions. But this is not the case in reality – the fluctuations might be rather stark and erratic. Though often less volatile than stocks, mutual funds are no exception to volatile, erratic behaviour. Standard deviation is one such measure that helps trace the behaviour of an investment with fluctuations and changes in the market over time.
What is market volatility?
Volatility refers to the extent to which a fund’s net asset value (NAV) fluctuates over a period of time. It is usually measured by calculating the average difference between the highest and lowest price of the asset.
Volatility is not the same as risk, but it is an anticipation or reaction to a risk event. A highly volatile fund poses greater risk to the investor than a fund with lower volatility. Volatility in the market provides the investors an impression that they are losing out on money, but that is not necessarily true. Being reactionary to the volatility in the market can prove to be detrimental to the investors interest in the longer run. Market volatility is usually measured with the help of beta ratio and standard deviation.
What is Standard Deviation?
A tool of statistics, standard deviation is used to measure variation from an arithmetic mean. In finance, standard deviation refers to a statistical measure representing the volatility or risk in a market instrument such as stocks, mutual funds etc.
In other words, it is a measure of how much deviation occurs from the expected return of the instrument in question. The words volatility and standard deviation are used interchangeably. The higher the standard deviation, the greater the fluctuation is.
How to calculate standard deviation?
It is calculated as the square root of variance.
The rates of return for the period that one wishes to measure must be added up and divided by the total number of data points to find the average return, following which each individual data point must be deducted from the average to get the differences between reality and the average. The square of each of these numbers must be added and the result must be divided by the total number of data points minus 1.
Mathematically, it is represented as –
Standard Deviation = [1/n * (xi – x)2]1/2
where:
xi = each datapoint
x = mean
n = number of datapoints or time periods
Use of Standard Deviation in Mutual Funds
It is used to measure the distribution of the actual return from the mutual fund’s expected annual return.
Say the standard deviation is 4% from the expected 10% return. This implies that the mutual funds return ranges from 6% to 14%.
This is widely used due to its consistency.
How to interpret Standard Deviation with respect to investments?
Standard deviation is a good measure of market volatility and the response of the mutual fund to this volatility. This enables the investor to make an informed choice.
A higher deviation reflects higher volatility and the opposite holds true too.
For example, a growth-oriented fund or an emerging market fund will have greater volatility than a debt fund. But just because a fund has a higher standard deviation, it does not automatically imply that the fund is performing worse off than a fund with a lower standard deviation. The deviation tends to become a secondary consideration if the former fund performs better irrespective.
Measuring standard deviation will help the investors see how consistent the rate of return has been over a time period.
An equity category – mid cap fund or a sectoral fund or a multi cap fund usually has a higher standard deviation in comparison with large-cap or balanced funds.
In debt funds, Gilt funds and Income funds have higher volatility (by extension, higher standard deviation) than Liquid funds.
Is Standard Deviation a good measure of risk?
It can be used to analyse the historical performance of a fund in isolation.
If the portfolio has several funds, then standard deviation cannot provide any comparable results.
Simply averaging out the standard deviations, is no answer to understanding the market volatility of the portfolio. The inherent risk in a mutual fund is revealed by the standard deviation.
Beta, on the other hand, is used to quantify the fund’s response to market volatility. It is a representation of the relative risk of the fund and not the inherent risk of investing in that particular fund.
It can prevent the investor from buying a mutual fund that is too aggressive or is too volatile.
Limitations
Though it provides insight into the volatility of a particular mutual fund, there are some limitations of using Standard deviation.
- It can only show the distribution of annual returns but at no point does not imply the future consistency of the investment.
- This does not show the performance of the fund when compared to its benchmark.
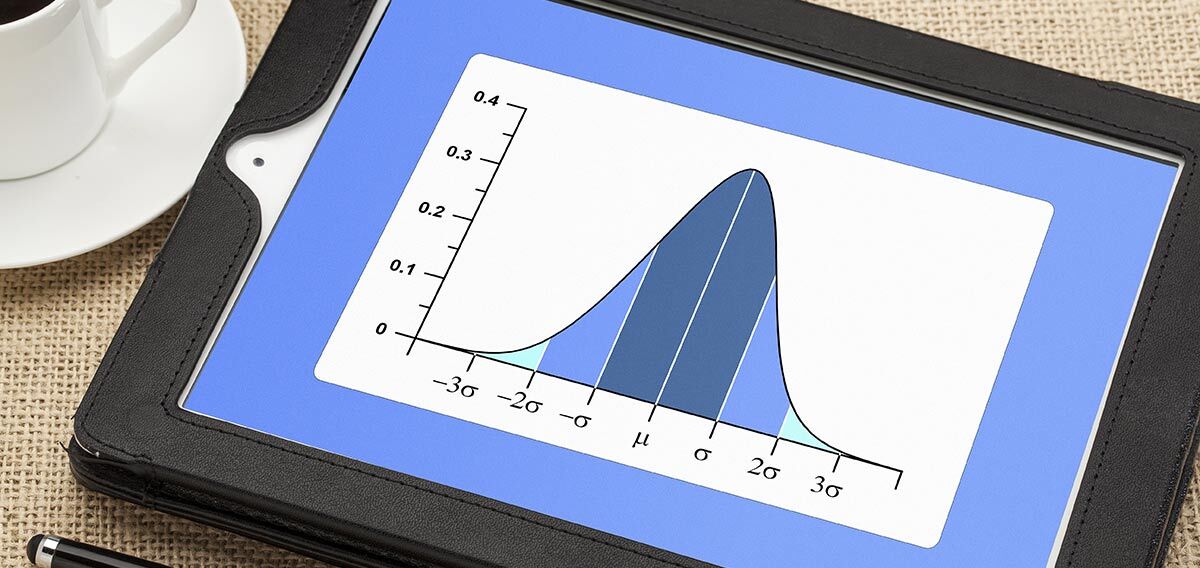
- This shows a bell-shaped movement of data values showing that the same probability is there in terms of achieving values below or above the mean value.
- It cannot be applied when a portfolio has multiple funds within it.
- The accuracy of the data rests in the size of the data set, i.e. the larger the data set, the more accurate the standard deviation is.
Standard Deviation and Bollinger Bands
In the investment world, standard deviations are demonstrated with the help of Bollinger Bands.
Bollinger bands is a technical analysis tool designed to discover probabilities of when an asset is oversold or overbought. Bollinger Bands are composed of three main lines namely, a simple moving average (middle band) and an upper and lower band. The simple moving average (SMA) generally uses a 20-day period wherein, it averages out the closing prices for the first twenty days as the first data point.
These bands, like the standard deviation, depict the volatility of the market – the bands widen to indicate higher volatility and contract to indicate lower volatility which is also known as the ‘squeeze’.
Conclusion
Standard deviation is a measure that can measure the riskiness of a mutual fund but not the only one that you should rely on before making an investment decision. You should use standard deviation along with other quantitative and qualitative measures for evaluating a mutual fund.
FAQs
- What can you learn from standard deviation?
The standard deviation allows you to measure the variability in the performance of a mutual fund. WIth this, you can take a more informed decision regarding the funds you want to invest in.
- How do you know if a standard deviation is high?
A standard deviation that is close to zero indicates that the values are closer to the expected performance. The higher the number is from zero, the more variance there is with regards to the expected performance.
- Does a high standard deviation indicate higher risk?
Yes, the higher the standard deviation indicates the greater risk, which can be evaluated through other indicators as well.