
Trading has become a popular career choice in recent years with the increasing awareness and technology-based trading platforms that make real-time trading more user-friendly and efficient. There are many types of trading like day trading, swing trading, scalping, forex trading, futures and options trading, and more. Swing trading is quite popular among traders and allows them to make a healthy portfolio of short-term gains. Here are the top trading strategies and other details for swing trading.
Read More: Differences between Long-term Intraday and Swing Trading
What is swing trading?
Swing trading is a type of trading strategy where traders buy or sell a financial asset, such as stocks or currencies, with the goal of profiting from short-term price movements that typically last a few days to a few weeks.
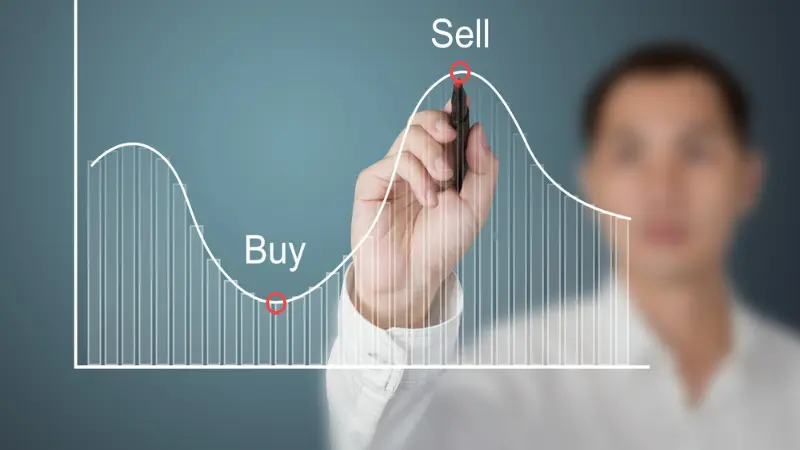
In swing trading, traders try to identify market trends and use technical analysis tools to identify entry and exit points for their trades. Such traders aim to capture price movements that occur within the trend. This implies usually buying when the price is low and selling when the price is high.
What are the top 5 swing trading strategies?
1. Fibonacci Retracement
The Fibonacci Retracement strategy is a popular technical analysis tool used in swing trading to identify potential levels of support and resistance in an asset’s price movement. The strategy is based on the idea that after a significant price move, an asset will often retrace a predictable portion of that move before resuming its trend. The Fibonacci retracement levels are based on mathematical ratios that are derived from the Fibonacci sequence of numbers.
To use the strategy, traders first identify a significant price move, such as a recent uptrend or downtrend, and then apply the Fibonacci retracement levels to that move. These levels act as potential support or resistance levels where the asset’s price may reverse direction.
The most commonly used Fibonacci retracement levels are 38.2%, 50%, and 61.8%. Traders would look for the price to pull back to one of these levels before entering a trade in the direction of the trend. For example, if an asset has been in an uptrend and the price pulls back to the 50% retracement level, traders may look to enter a long position with the expectation that the price will resume its upward trend.
2. Trend Trading
Trend trading is a popular swing trading strategy that involves identifying and following the current trend of a financial asset. Traders using this strategy aim to profit from the momentum of the trend by entering trades in the direction of the trend.
To identify the trend, traders use technical analysis tools, such as moving averages or trendlines to determine whether the asset’s price is trending upwards, downwards, or sideways. Once the trend is identified, traders will typically enter a trade in the direction of the trend, expecting the trend to continue. For example, if an asset is in an uptrend, traders using the trend trading strategy would look for opportunities to enter long positions, such as buying on pullbacks or breakouts. Conversely, if an asset is in a downtrend, traders would look for opportunities to enter short positions.
3. Reversal trading
Reversal trading is a swing trading strategy that involves identifying potential trend reversals in a financial asset’s price movement. Traders using this strategy aim to profit from the reversal by entering trades in the opposite direction of the previous trend.
To identify a potential trend reversal, traders use technical analysis tools, such as chart patterns, indicators, or support and resistance levels. Once a potential reversal is identified, traders will typically enter a trade in the direction of the reversal, expecting the price to continue in that direction. For example, if an asset has been in a downtrend and shows signs of a potential reversal, such as a bullish chart pattern or a break above a key resistance level, traders using the reversal trading strategy would look for opportunities to enter long positions. Conversely, if an asset has been in an uptrend and shows signs of a potential reversal, such as a bearish chart pattern or a break below a key support level, traders would look for opportunities to enter short positions.
4. Breakout strategy
Breakout trading is a swing trading strategy that involves identifying potential breakouts in the price movement of a financial asset. Traders using this strategy aim to profit from the momentum of the breakout by entering trades in the direction of the breakout.
To identify a potential breakout, traders use technical analysis tools, such as trendlines, support, and resistance levels, or chart patterns. Once a potential breakout is identified, traders will typically enter a trade in the direction of the breakout, expecting the price to continue in that direction. For example, if an asset is trading within a range between two key levels of support and resistance and shows signs of breaking above the resistance level, traders using the breakout trading strategy would look for opportunities to enter long positions. Conversely, if an asset is trading within a range and shows signs of breaking below the support level, traders would look for opportunities to enter short positions.
5. Simple Moving Averages
The Simple Moving Average (SMA) is a popular swing trading strategy that involves using a specific type of moving average indicator to identify potential buy and sell signals in the price movement of a financial asset.
The SMA is a technical indicator that calculates the average price of an asset over a specific period of time. Traders using this strategy look at the relationship between the current price and the SMA to identify potential trading opportunities. For example, if the current price of an asset is above the SMA, traders using the SMA swing trading strategy would look for opportunities to enter long positions, as this indicates a potential uptrend. Conversely, if the current price is below the SMA, traders would look for opportunities to enter short positions, as this indicates a potential downtrend.
The period length of the SMA is based on the trader’s preferred time frame and can range from a few days to several months. The shorter the period length, the more sensitive the indicator is to price changes, but it may also produce more false signals. Conversely, a longer period length may produce fewer false signals but may also result in delayed signals.
What are the pros and cons of swing trading?
Some of the key pros and cons of swing trading are highlighted below.
Advantages of Swing trading
Potential for higher returns
Swing trading offers traders the potential for higher returns compared to day trading or long-term investing. By capturing more significant price moves over a few days to a few weeks, swing traders can potentially earn higher profits. This is because they are able to take advantage of market trends and momentum, which can result in more significant gains.
Flexibility
Swing trading is a part-time activity, which allows traders to pursue other activities or have other jobs while trading. This makes it a great option for those who don’t have the time or resources to dedicate to full-time trading.
Less stressful than day trading
Day trading requires traders to monitor the markets constantly and make quick decisions, which can be stressful. On the other hand, swing trading involves holding positions for longer periods of time, which reduces the need for constant monitoring. This can make it less stressful than day trading.
Use of technical analysis
Swing traders often use technical analysis to identify potential trading opportunities. Technical analysis involves using charts, indicators, and other tools to analyze market trends and price movements. This can help traders make more informed decisions and increase their chances of success.
Disadvantages of swing trading
Risk of larger losses
Swing trading can also result in larger potential losses compared to day trading or long-term investing. This is because swing traders hold positions for longer periods of time and may be exposed to market risks, such as unexpected news events or changes in market sentiment. As a result, swing traders need to be aware of the potential risks and use proper risk management techniques, such as stop-loss orders, to limit potential losses.
Requires more patience
Swing trading requires more patience and discipline than day trading. This is because traders need to wait for the right opportunities to present themselves before making trades. Swing traders need to have a well-defined trading plan and stick to it to avoid making impulsive decisions.
Requires more time and effort than long-term investing
While swing trading is a part-time activity, it still requires more time and effort than long-term investing. Traders need to monitor the markets and make more frequent trades actively. Additionally, swing traders need to stay up-to-date with market news and events that can impact their positions.
Can be affected by unexpected news events
Swing traders may be caught off guard by unexpected news events that can quickly impact the markets and their positions. This can result in losses if they are not prepared for such events. As a result, swing traders need to be aware of the potential risks and be prepared to adjust their positions in response to unexpected news events.
Conclusion
Swing trading is a popular form of trading for millions of traders and huge volumes of transactions on a daily basis are attributed to swing trading. Traders should apply the swing trading strategies after thoroughly understanding them to ensure that these strategies are implemented effectively. These strategies can be implemented for a host of products like stocks, currency, and commodities to find opportune entry and exit points for successful trading.
FAQs
The 1% rule in swing trading is followed by most experts under which only up to 1% or less of the capital is risked per trade. This rule ensures that the traders protect their money from market volatility.
The few indicators used in swing trading include the RSI indicator, Stochastic Oscillator, Moving Averages, and volume indicators.
Some of the costs associated with swing trading are brokerage fees, STT, GST, Demat opening charges, other charges like stamp duty charges, exchange transaction charges, and regulatory charges.
The basic difference between scalping and swing trading is the time frame in which swing traders hold positions for several days while scalping is an Intraday trading form that happens in a few seconds and is usually done by algo traders. The logic here is to take many trades with small profit. whereas swing traders aim for higher profits.


