

The use of technical analysis is one of the crucial steps in stock trading. It helps traders understand the securities and their price and volume movements thereby enabling effective trading decisions. When we talk about technical analysis the term stock charts is among the most commonly used terms or resources. Stock charts are an indispensable part of technical analysis and can create a whole picture of the historical performance as well as the potential future trajectory of security. But did you know stock charts are not just lines on the screen, but are of many types with varied significance? Check out this blog to know more about stock charts and different types of stock charts that can be used by traders.
Read More: How to read stock charts?
What are stock charts?
Stock charts are visual representations of historical price and volume data of a particular stock or security. They provide valuable information to traders for analysing and interpreting market trends, volume, support and resistance levels, and chart patterns. Stock charts are typically displayed in a graphical format with the stock’s price plotted on the vertical axis (y-axis) and the time period on the horizontal axis (x-axis). Stock charts are used to analyze trends, identify entry and exit points, manage risk, and develop trading strategies. It helps them make informed decisions based on price patterns, indicators, and historical data. By studying stock charts, traders gain insights into market dynamics and improve their trading performance.
What are the types of charts in stock markets?
Now that we have seen how crucial stock charts are for trading, let us now have a look at the most common types of stock charts and their key details.
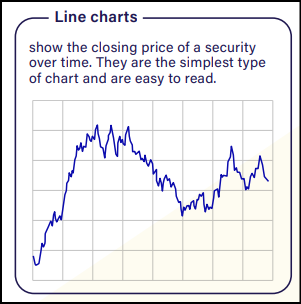
Line Charts
A line chart is the most basic and commonly used type of chart. It is a series of dots representing the closing price of the stock over a period of time and when connected they form a line that creates a visual representation of the stock’s price trend. This helps us visualize the overall trend of the stock’s price movement. Line charts are useful for identifying whether the stock is generally going up (an uptrend), going down (a downtrend), or moving sideways. They provide a clear picture of the stock’s performance over time.
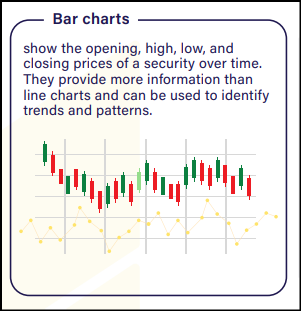
Bar Charts
A bar chart is an enhanced version of a line chart and provides more detailed information. Instead of a simple dot, each mark on a bar chart is represented by a vertical line with two horizontal lines extending from it. The top point of the vertical line represents the highest price the stock reached during the day, while the bottom point represents the lowest price. The horizontal lines on the left and right sides represent the opening and closing prices, respectively. Bar charts not only display prices but also reflect price volatility, which is useful for understanding risk levels. Longer vertical lines indicate higher price differences between the opening and closing prices, indicating greater volatility and potentially higher risk. Therefore, bar charts offer additional advantages over line charts by providing insights into both prices and volatility.
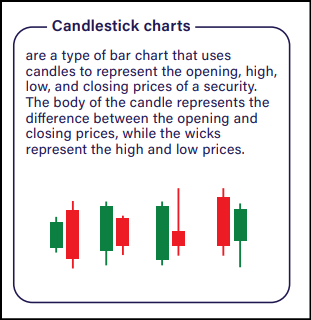
Candlestick Charts
Candlestick charts provide detailed information about price movements within a specific time period, similar to bar charts. Each “candlestick” represents a period, and it has a rectangular body and thin lines, called “wicks” or “shadows,” extending from the top and bottom. The body represents the opening and closing prices, while the wicks represent the highest and lowest prices reached during that period. Candlestick charts are known for their visual appeal and ability to reveal patterns and trends. They help us identify bullish (positive) and bearish (negative) market sentiment, spot potential reversals, and understand price dynamics through patterns like “doji” (when the opening and closing prices are nearly the same) or “engulfing” (when one candlestick completely engulfs the previous one).
Renko Charts
Renko charts focus solely on price movements and ignore time. They consist of “bricks” that are added or removed based on specific price increments or “box sizes.” When the price moves beyond the box size, a new brick is added in the corresponding direction. Renko charts filter out small price fluctuations and emphasize significant price movements. They help traders identify trends, support and resistance levels, and potential reversals in a more simplified manner.
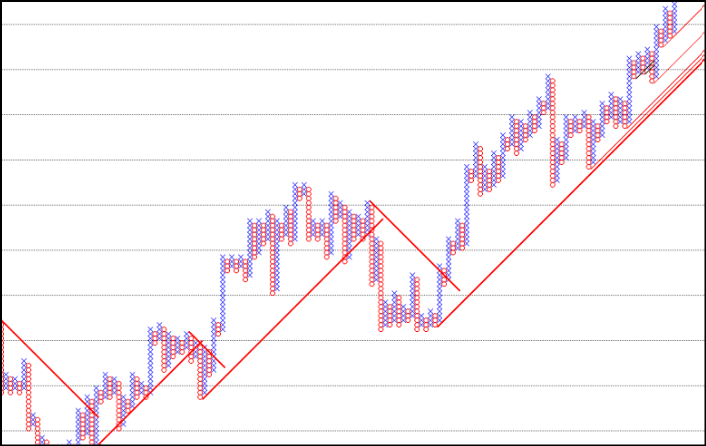
Point and Figure Charts
Point and figure charts focus on significant price movements and filter out minor fluctuations and noise. They use Xs and Os to represent upward and downward movements, respectively. Each “column” on the chart represents a price increment. When the price reaches a certain threshold, a new column is formed, and the Xs or Os are added accordingly. Point and figure charts help us identify long-term trends, support and resistance levels, and potential price targets.
How are stock charts important in technical analysis?
We have established that stock charts and a very vital part of technical analysis. But the impending question is ‘why’. The answer to this question and the importance of stock charts are highlighted hereunder.
- Stock charts provide a visual representation of price and volume data, making it easier for traders to interpret market trends and patterns.
- Traders can identify various price patterns such as trends, reversals, and consolidations, using stock charts which can indicate potential buying or selling opportunities. Furthermore, stock charts help identify key support and resistance levels, which are price levels where the stock tends to find buying or selling pressure. These levels act as important reference points for traders to make trading decisions.
- By analyzing stock charts, traders can determine the direction of the overall trend, whether it is bullish (upward), bearish (downward), or sideways, and adjust their trading strategies accordingly. Viewing stock charts at different timeframes, allows traders to analyze short-term and long-term trends.
- Stock charts allow the integration of technical indicators such as moving averages, oscillators, and trend lines. These indicators provide additional insights into price momentum, overbought or oversold conditions, and potential trend reversals.
- Stock charts display trading volume, which indicates the level of participation and interest in a particular stock.
- Stock charts also help in identifying chart patterns such as head and shoulders, double tops or bottoms, triangles, and flags. These patterns can provide clues about potential price movements and help traders anticipate future market behaviour.
Conclusion
Stock charts are used to understand the price and volume movements of the stock or any other security in consideration. They are an important arsenal in a trader’s kitty and therefore, having a clear understanding and the ability to read stock charts is crucial for having a successful trading portfolio.
FAQs
Some of the common technical indicators used by traders for stock trading include moving averages, relative strength index (RSI), MACD (Moving Average Convergence Divergence), and Bollinger Bands.
Line charts are the most basic form of stock charts used by traders.
A few more price charts include volume charts, tick charts, range bar charts, area charts, Heikin Ashi Charts, etc.
The principles of technical analysis involve the belief that market prices reflect all available information, price trends tend to persist over time, and historical price patterns can help predict future price movements.


