

Technical analysis is a crucial pillar for stock trading and involves analysing the price and volume movement of the stock or any security being traded. One of the critical concepts in trading is understanding the support and resistance levels for security. This helps in ascertaining the entry and exit points for traders. But what is the meaning of these levels and how to identify them? Given here is the meaning of support and resistance levels in technical analysis and their related concepts.
Read More: What are technical indicators? Top 5 commonly used technical indicators
What is support?
In technical analysis, support refers to a price level where the demand for a stock is expected to be strong enough to prevent its price from falling further. It is represented on charts by a horizontal line at a specific price point.
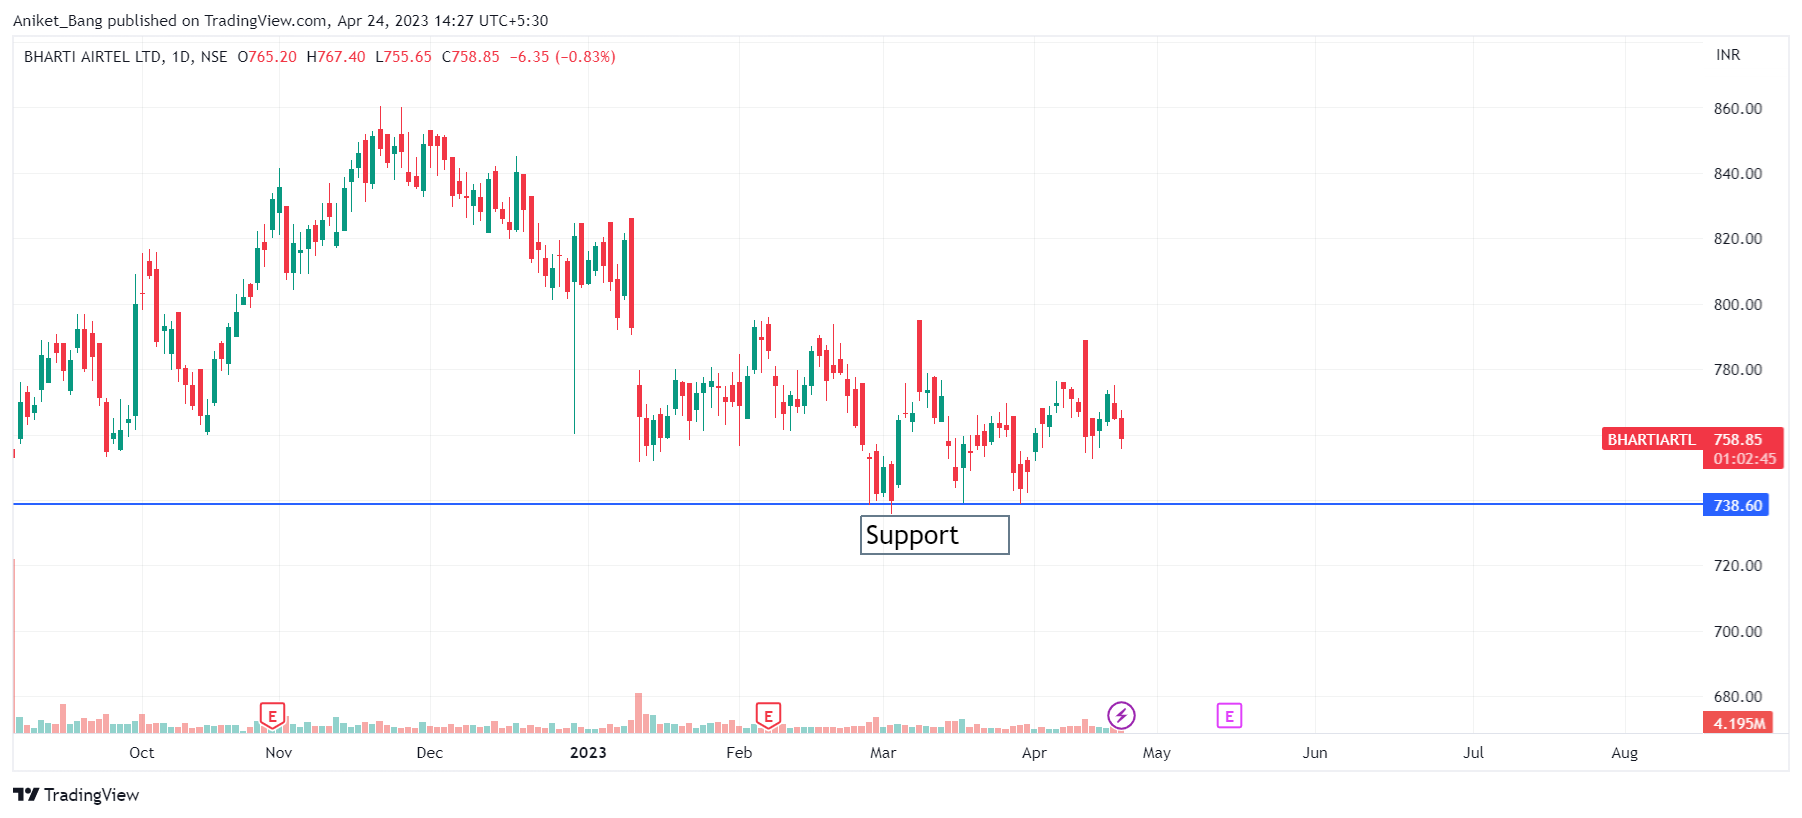
When a stock’s price has been decreasing steadily, the support level is the point at which it seems to have stopped falling and started to increase. This level is important to traders because it can indicate market sentiment. If a stock’s price reaches a support level and rebounds, it suggests that there are buyers willing to purchase it at that level, potentially leading to further price increases. Conversely, if a stock’s price falls below the support level, it indicates that there may be stronger selling pressure than buying pressure, which could cause the price to continue to drop.
What is Resistance?
Resistance in technical analysis is a term used to describe a price level where selling pressure is anticipated to be strong enough to prevent the price from rising further. Traders use resistance levels to identify potential entry and exit points for any security. These levels are typically represented on charts by a horizontal line at a specific price point.
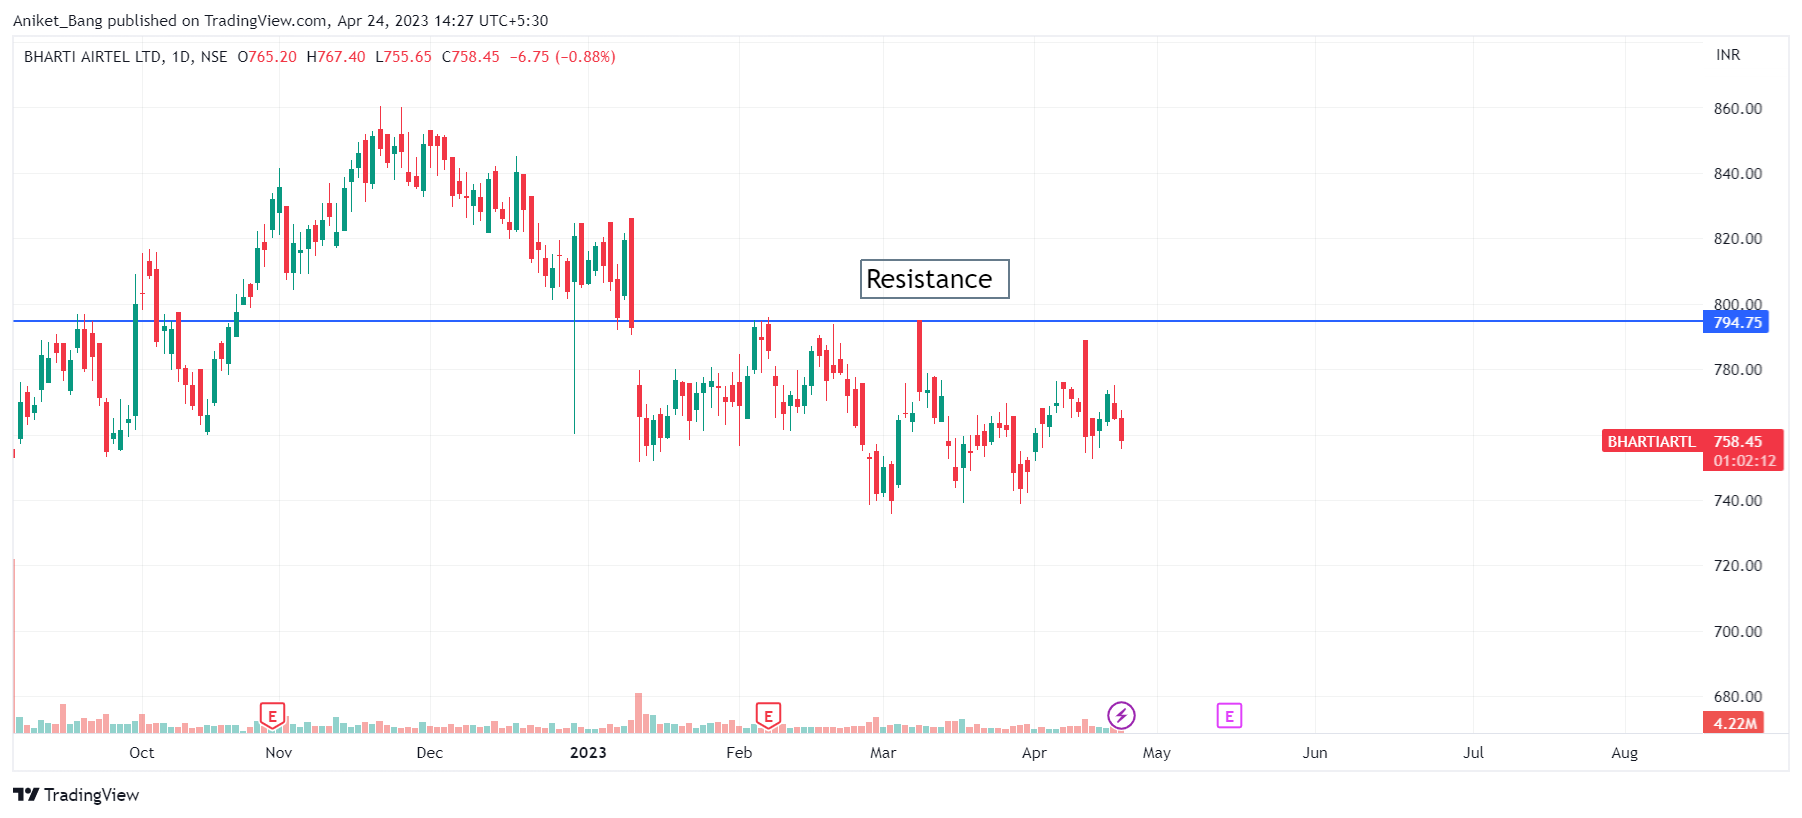
For example, let’s say a trader is monitoring a stock’s chart and notices that its price has been steadily increasing. As the trader continues to observe the chart, they notice that the price has halted its ascent at a particular level and has begun to decline. This level at which the price appears to have stopped rising is the resistance level.
Resistance levels are important because they can signal market sentiment and help traders make informed decisions about when to buy or sell. If a stock’s price reaches a resistance level and begins to decline, it may indicate that there are many sellers willing to sell at that price, potentially leading to further price drops. Alternatively, if a stock’s price surpasses a resistance level and continues to rise, it may suggest that there is a strong demand for the stock, potentially leading to further price increases.
How to chart support and resistance levels for any security?
Most traders today use the charting softwares available on various portals to identify the support and resistance levels. However, it can also be done manually by following the steps given below.
- The first step is to choose the security that is to be analysed such as a stock, index, or currency pair.
- In the next step, traders will have to decide on the time frame they want to use for analysis, such as daily, weekly, or monthly charts.
- Following this, traders need to plot the price data of the security price data on a chart with the chosen time frame. This can be done using charting software or an online platform.
- The next step is to look for areas on the chart where the price has repeatedly bounced off a certain level (support) or struggled to break through a certain level (resistance). These levels can be identified by drawing horizontal lines on the chart at the appropriate price points.
- It is important to verify these levels by looking at the trading volume and price action around them. If there is high trading volume and price reversals around a level, it is likely a strong support or resistance level.
- Once the levels of support and resistance have been identified, they can be used to make trading decisions. For example, a trader may decide to buy when the price reaches a strong support level or sell when the price reaches a strong resistance level.
What are the indicators or strategies where support and resistance levels are used?
Support and resistance levels can be used in various indicators and strategies in technical analysis. Here are a few examples:
Trend lines
Trend lines are drawn to identify the direction of the trend in a security. When a trend line is drawn connecting a series of higher lows, it acts as a support level. Conversely, when a trend line is drawn connecting a series of lower highs, it acts as a resistance level.
Moving averages
Moving averages are used to smooth out price data and identify the overall trend in a security. When the price is above the moving average, it can act as a support level. When the price is below the moving average, it can act as a resistance level.
Breakout strategies
Breakout strategies are used to capitalize on price movements after security breaks through a key support or resistance level. Traders will often wait for the price to break through a level with high trading volume before entering a trade in the direction of the breakout.
Pivot points
Pivot points are a set of horizontal support and resistance levels that are calculated based on the previous day’s price action. Traders will often use these levels to identify potential entry and exit points for their trades.
Conclusion
Support and resistance levels are often considered to be among the key factors to consider while creating a trading portfolio. Therefore, it is important to have a thorough understanding of these concepts in order to trade successfully. Traders can use many stock scanners available today to review the support and resistance levels for different securities and accordingly decide on suitable entry and exit points.
FAQs
Support and Resistance levels are two separate price levels for a security. Support is a price level where demand is strong enough to prevent the price from falling further. Resistance, on the other hand, is a price level where supply is strong enough to prevent the price from rising further.
Some of the key factors that are considered in determining support and resistance levels include the price levels, the volume of the security being traded, and the timeframes for analysis.
Support and resistance levels can help traders identify potential entry and exit points for their trades, but it is important to have a risk management plan in place to protect against potential losses. Hence it is important to use stop loss while trading using support and resistance levels.
There are several commonly used technical indicators that can be helpful in identifying support and resistance levels like moving averages, Bollinger bands, Fibonacci retracements, and RSI indicator


