TL;DR – India–US Trade Deal
- The India–US trade deal removes a key policy overhang, with reciprocal tariffs on Indian goods reduced to 18% from a peak of 50%, improving trade visibility and external sentiment.
- The US is India’s largest export destination, accounting for ~20% of total merchandise exports (~USD 86.7 bn in FY25), making tariff clarity economically meaningful.
- India continues to run a sizeable trade surplus with the US (~USD 41 bn in FY25); while this surplus could narrow gradually over time as imports increase, near-term impact is more pronounced on the export side.
- Export benefits are uneven, as large categories such as pharma and electronics are already tariff-exempt; gains are more concentrated in tariff-sensitive segments like textiles, gems & jewellery, agriculture, and select engineering goods.
- Improved trade clarity has already supported sentiment, reflected in Rupee appreciation (~1.4%), early moderation in FPI outflows, and a short-term market recovery (~3%), though these should be viewed as sentiment indicators.
- Going forward, markets are expected to transition from policy-led moves to an earnings-driven phase, with portfolio positioning favouring balance and selectivity across market capitalisations.
Executive Summary
The announcement of the India–US trade deal marks an important development in the evolving trade relationship between the two countries and removes a key source of uncertainty that had persisted over the past year. The United States has agreed to reduce reciprocal tariffs on Indian goods to 18%, from levels that had earlier risen as high as 50%. This decision has immediate implications for India’s trade competitiveness, market sentiment, and the broader macro narrative.
The agreement follows a period of sharp and sequential tariff actions that materially increased uncertainty around India–US trade over the course of the past year. During this period, repeated changes in tariff policy added to volatility in export expectations and weighed on confidence across markets.
While the agreement does not, by itself, alter India’s long-term growth trajectory, it meaningfully improves near- to medium-term visibility by addressing a policy overhang that had weighed on exports, currency stability, and foreign capital flows.
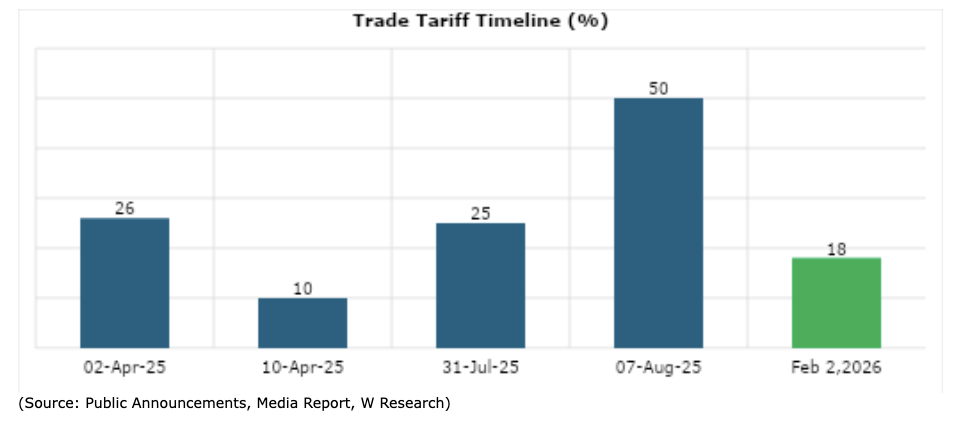
The tariff timeline highlights the rapid escalation in trade frictions through mid-2025, culminating in a peak effective tariff of 50% in August. This escalation was driven by a combination of reciprocal trade measures and additional penalties linked to geopolitical considerations, particularly India’s continued purchases of Russian oil.
The subsequent reduction in tariffs to 18% marks a clear inflection point. Beyond the numerical reduction, the shift restores a degree of predictability to India–US trade relations and reduces the risk of abrupt policy changes that had complicated planning for exporters and investors alike.
Why the Tariff Reduction Matters: Importance of the US as an Export Market
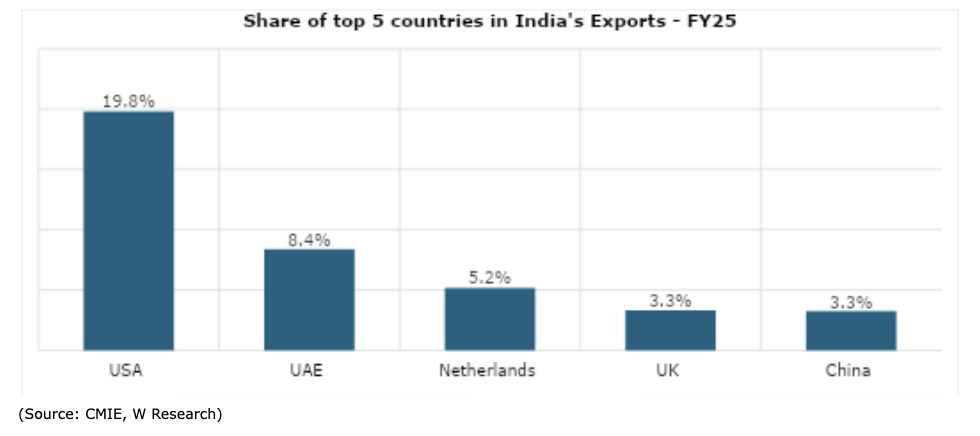
- [The US alone accounts for nearly one-fifth of India’s merchandise exports]
The importance of the tariff reduction is amplified by the scale of India’s export exposure to the United States. In FY25, the US accounted for 19.8% of India’s total merchandise exports, translating to export value of approximately USD 86.7 billion. This makes the US India’s single largest export destination by a wide margin.
In comparison, the next largest destinations were the UAE at 8.4% (USD 36.7 billion) and the Netherlands at 5.2% (USD 22.7 billion), followed by the UK and China at around 3.3% each (USD ~14.5 billion and USD ~14.3 billion, respectively). No other individual market contributes more than USD 13 billion to India’s export basket.
Given this concentration, changes in tariff policy for the US market have a disproportionate impact on India’s overall export competitiveness and trade outlook. Elevated tariffs therefore had a direct bearing on a significant portion of India’s export flows, while the reduction to 18% meaningfully improves visibility for exports to India’s most important overseas market.
Trade Structure: Where the Impact Is Concentrated
India currently runs a sizeable trade surplus with the US, with exports of ~USD 86.7 billion versus imports of ~USD 45.6 billion in FY25, implying a surplus of around USD 41 billion. While the reduction in tariffs improves overall trade visibility, the incremental benefit on the export side is likely to be uneven, as several large export categories such as pharmaceuticals and electronics already enjoy tariff exemptions. As a result, near-term gains are expected to be more concentrated in tariff-sensitive segments such as textiles, gems and jewellery, agriculture, and select engineering goods, even as the broader agreement supports deeper bilateral trade engagement over time.
- India’s Export to US (FY25)
India’s exports to the US are concentrated in a few large categories, with textiles, electronics, pharmaceuticals, and gems and jewellery accounting for a significant share of export value. While some categories remain tariff-exempt, a meaningful portion of exports continues to face elevated duties, making the recent tariff reduction particularly relevant for labour-intensive segments.
| Goods Category | Exports (USD bn) | Share in total goods exports (%) | Current tariff rate |
| Electronics | 15 | 3.4 | 0% |
| Pharma | 11 | 2.5 | 0% |
| Textiles | 25 | 5.7 | 50% |
| Gems / Jewellery | 10 | 2.3 | 50% |
| Machinery | 8 | 1.8 | 25%–50% |
| Agriculture | 6 | 1.4 | 50% |
(Source: CMIE, Mirae AMC, W Research)
- India’s Import from US (FY25)
India’s imports from the US are concentrated in petroleum, metals and minerals, electronics, and chemicals, with relatively lower tariff incidence across most large-ticket categories. While agriculture and transport equipment face higher weighted average tariffs, the overall import basket reflects limited near-term sensitivity compared with exports, reinforcing that the immediate economic impact of the trade deal is more pronounced on the export side.
| Goods Category | Imports (USD bn) | Current weighted average tariff rate |
| Agriculture products | 2 | ~35–40% |
| Chemicals | 4 | ~9–10% |
| Transport equipment | 3 | ~20–22% |
| Metals and minerals | 6 | ~9–10% |
| Petroleum | 10 | ~4% |
| Electronics | 6 | ~8–11% |
(Source: CMIE, Mirae AMC, W Research)