Key Developments, Trade Impact and Portfolio Implications
- Executive Summary
India and the European Union have concluded negotiations on a comprehensive Free Trade Agreement (FTA), marking a major milestone in India’s global trade engagement. The agreement provides unprecedented market access for Indian exports to the EU, particularly benefitting labour-intensive manufacturing and select industrial sectors, while safeguarding sensitive domestic segments. From an investment perspective, the FTA is a structural positive for India’s export ecosystem and strengthens the medium-to-long-term earnings visibility for export-oriented sectors.
- What Has Happened – The Facts
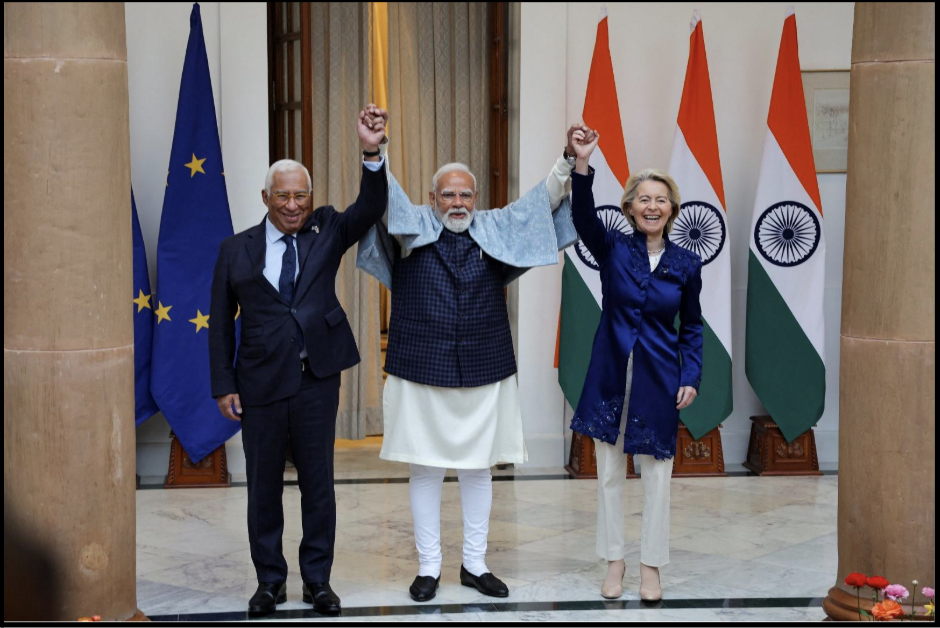
- The India–EU FTA was announced at the 16th India–EU Summit by the Hon’ble Prime Minister of India and the President of the European Commission.
- The agreement links the world’s 4th largest economy (India) with the 2nd largest economy (EU), together accounting for ~25% of global GDP.
- The EU becomes India’s 22nd FTA partner. Along with recent FTAs with the UK and EFTA, India now has preferential access to most of the European market.
- The agreement is comprehensive, covering trade in goods, services, mobility of professionals, MSMEs, digital trade, sustainability, and regulatory cooperation.
The FTA is positioned as a modern, rules-based trade partnership rather than a narrow tariff-cutting exercise.
- Why This Matters
Despite steady growth in India–EU trade, several Indian export sectors have historically operated under meaningfully higher EU import duties, which limited price flexibility and market penetration. The FTA directly addresses this constraint by removing or reducing EU tariffs across a large share of India’s export basket.
For investors, the relevance of the agreement stems from what changes mechanically:
- EU import duties of up to 12–26% on key Indian exports move to zero or near-zero, altering relative pricing versus competing suppliers.
- India’s decision to exclude sensitive agricultural and dairy sectors ensures that the upside is not offset by domestic supply-side disruptions.
As a result, the FTA should be viewed as a structural change in export cost structures for select sectors, with implications that play out gradually through market share and scale, rather than as an immediate macro or earnings catalyst.
- What Changed – Tariff and Market Access Snapshot
- India’s Access to the EU Market
Preferential access granted by the European Union to Indian exports under the FTA.
| Metric | Outcome |
| Tariff lines with preferential access | ~97% |
| Export value covered | ~99–99.5% |
| Immediate zero-duty access | ~70% of tariff lines (over 90% of export value) |
| Phased tariff elimination | ~20% of tariff lines over 3–5 years |
| Partial reductions / TRQs | ~6% of tariff lines |
- Key Sector Tariffs – EU Import Duties on Indian Exports
- EU Import Duties on Indian Exports (Export Benefit for India)
| Sector | EU Import Duties on Indian Exports (Pre-FTA) | Post-FTA Outcome | Sectoral Impact |
| Textiles & Apparel | Up to ~12% charged by EU | Zero duty | Structural improvement in export competitiveness; supports scale-up |
| Leather & Footwear | Up to ~17% charged by EU | Zero duty | Positive for labour-intensive, MSME-led exporters |
| Marine Products | Up to ~26% charged by EU | Zero / phased | Meaningful reset in export economics for seafood exporters |
| Chemicals | Up to ~12.8% charged by EU | Zero duty on ~97.5% of exports | Supports growth in specialty and value-added segments |
| Engineering Goods | Up to ~22% charged by EU | Eliminated / reduced | Aids integration into EU manufacturing supply chains |
| Medical Devices | Up to ~6.7% charged by EU | Zero duty on ~99% lines | Lowers cost barriers in regulated EU markets |
| Plastics & Rubber | Up to ~10% charged by EU | Preferential / zero duty | Improves relative positioning versus global peers |
| Furniture & Home Décor | Up to ~10.5% charged by EU | Reduced / phased | Favourable for organised, design-led exporters |
- Automobiles – Two-Way, Calibrated Liberalisation
| Aspect | Change Under the India–EU FTA | Sectoral Impact |
| India’s import duty on EU cars | Reduced sharply under a quota-based framework | Increased competition in premium segments |
| EU market access for Indian autos | Reciprocal but limited | Export upside remains selective |
| Safeguards | Volume caps and phased implementation | Limits disruption to domestic auto industry |
- Sectoral Impact: Summary
| Sector | Nature of Impact | Investment Interpretation |
| Textiles & Apparel | Immediate | Margin headroom and volume optionality improve |
| Leather & Footwear | Immediate | Earnings visibility improves for MSME-led exporters |
| Marine Products | Near-term | High tariff removal supports operating leverage |
| Chemicals | Near to Medium-term | Scale and pricing power improve, especially in specialties |
| Engineering Goods | Medium-term | Better integration into EU supply chains aids steady growth |
| Medical Devices | Near-term | Lower entry barriers improve growth optionality |
| Plastics & Rubber | Medium-term | Relative competitiveness versus peers improves |
| Furniture & Home Décor | Medium-term | Shift towards value-added exports supports margins |
| Automobiles & Ancillaries | Optionality | Gradual access without near-term earnings disruption |
| Dairy & Sensitive Agri | Neutral | No material earnings impact due to safeguards |
- Putting It Together – Portfolio Context
The conclusion of the India–EU Free Trade Agreement represents a historic milestone in India’s trade engagement with developed markets, providing unprecedented market access for Indian exports and strengthening India’s integration into European and global value chains. By materially lowering EU import duties across a wide range of sectors, the agreement reshapes the external operating environment for export-oriented manufacturing and industrial segments in a durable manner.
From a portfolio perspective, the importance of the agreement lies in the ecosystem it reinforces, rather than in triggering a change in investment strategy. The FTA strengthens the relevance of scalable, execution-driven business models that are positioned to participate in export-led and manufacturing-linked growth.
Our existing strategies are well positioned within this evolving ecosystem, given their focus on companies with proven scale, strong execution capability and sound balance-sheet strength. The agreement therefore acts as a validation of current positioning, supporting the durability of underlying investment themes rather than necessitating any material shift in portfolio strategy.
Overall, the India–EU FTA should be viewed as a structural enabler that deepens long-term opportunities for Indian exporters and manufacturing-linked businesses. For portfolios, it reinforces the case for maintaining exposure to companies positioned to participate in India’s expanding global footprint, with benefits accruing over time rather than through near-term tactical adjustments.
- Indices Performance for 27th January 2026
| Name | Day Change % |
| BSE Metal | 3.1 |
| S&P BSE Services | 2.0 |
| S&P BSE BasicMat | 1.9 |
| Nifty Commodities | 1.7 |
| S&P BSE PSU | 1.6 |
| BSE BANKEX | 1.3 |
| S&P BSE India Infrastructure | 1.0 |
| S&P BSE Utiliti. | 0.9 |
| BSE Oil&Gas | 0.9 |
| S&P BSE Finance | 0.9 |
| BSE Cap Goods | 0.8 |
| BSE IT Sector | 0.7 |
| S&P BSE Energy | 0.6 |
| BSE Power | 0.6 |
| S&P BSE Industrials | 0.6 |
| BSE Sensex | 0.4 |
| BSE Tech | 0.4 |
| S&P BSE India Manufacturing | 0.3 |
| BSE Realty Index | 0.2 |
| BSE Healthcare | -0.1 |
| BSE FMCG Sector | -0.5 |
| BSE Consumer Discretionary Goods and Services | -0.7 |
| BSE Auto | -1.0 |
| BSE Consumer Durables | -1.2 |