

|
||||||||||||||||||||||||||
| ||||||||||||||||||||||||||
Technical Overview – Nifty 50 | ||||||||||||||||||||||||||
| ||||||||||||||||||||||||||
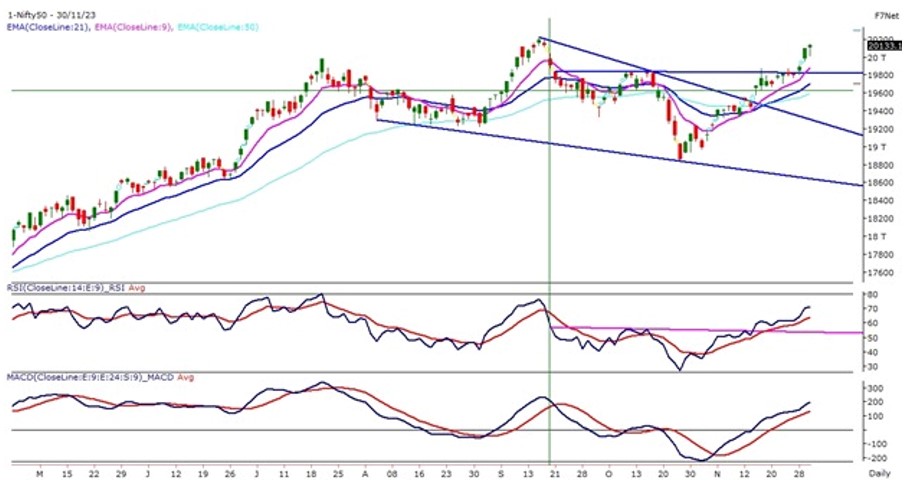
The Nifty50 on its monthly expiry day witnessed a flat opening above 20,100 levels traded within the tight range throughout the day and closed the November month with a massive gain of more than 5%. The Index has formed a tall bullish candle on the monthly chart and has engulfed its previous four months’ candles suggesting a solid buying. The Index on the daily chart has also given a horizontal trend line breakout and prices are trading above the range of the breakout. The prices on the daily chart post 26th October, are trading in a higher high higher low formation and constantly trading above their 9 & 21 EMA. The momentum oscillator RSI (14) is reading in a higher high formation post-26th October and has also given a horizontal trend line breakout near 50 levels and moved higher with a bullish crossover. The immediate support for the Index has shifted higher near 20,000 levels as prices have witnessed a range breakout and the immediate resistance is likely to be capped below 20,250 levels. | ||||||||||||||||||||||||||
Technical Overview – Bank Nifty | ||||||||||||||||||||||||||
| ||||||||||||||||||||||||||
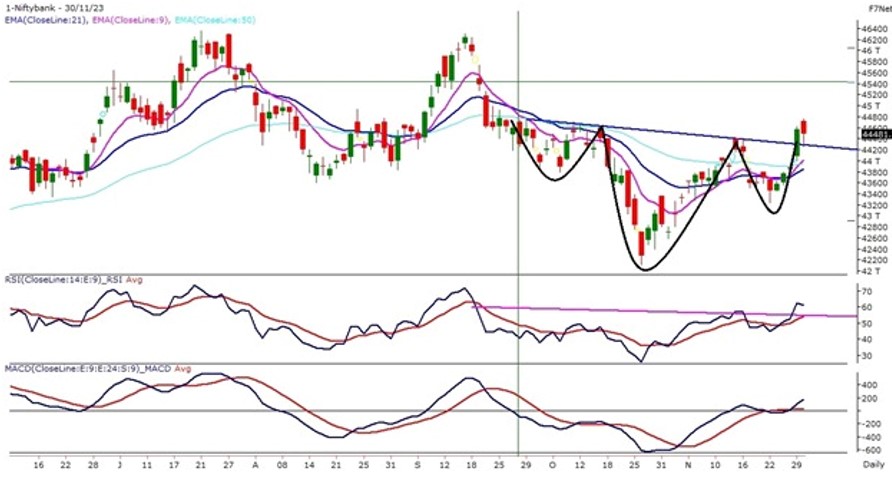
The Bank Nifty on its monthly expiry day witnessed a super volatility where prices registered an intraday low at 44,254 levels and post that witnessed a smart recovery of more than 200 points from the day’s low. The Banking Index has formed a tall bullish candle on the monthly chart and has formed a bullish piercing candle stick pattern with a gain of close to 4%. The Bank Nifty on the daily chart has witnessed an inverted head & shoulder pattern breakout and the index has closed above the neckline of the pattern. On 30th November the prices completed the retest of the pattern near the neckline support. The momentum oscillator RSI (14) is reading in a higher high formation post-26th October and has also given a horizontal trend line breakout near 60 levels and moved higher with a bullish crossover. Presently the Index is trading comfortably above its short and medium-term averages on the daily time frame, which is a positive sign for the index. The immediate support for the Banking Index has shifted higher near 44,200 levels as prices have witnessed a range breakout and the immediate resistance is likely to be capped below 45,400 levels. | ||||||||||||||||||||||||||
Indian markets:
| ||||||||||||||||||||||||||
Global Markets
| ||||||||||||||||||||||||||
Stocks in Spotlight
| ||||||||||||||||||||||||||
News from the IPO world🌐
| ||||||||||||||||||||||||||
|
Day Leader Board
| ||||||||||||||||||||||||||
Sectoral Performance
| ||||||||||||||||||||||||||
Advance Decline Ratio
| ||||||||||||||||||||||||||
Numbers to track
| ||||||||||||||||||||||||||
|
Please visit www.fisdom.com for a standard disclaimer. |