


|
||||||||||||||||||||||||||
The Markets Today in a nutshell | ||||||||||||||||||||||||||
| ||||||||||||||||||||||||||
Technical Overview – Nifty 50 | ||||||||||||||||||||||||||
 |
||||||||||||||||||||||||||
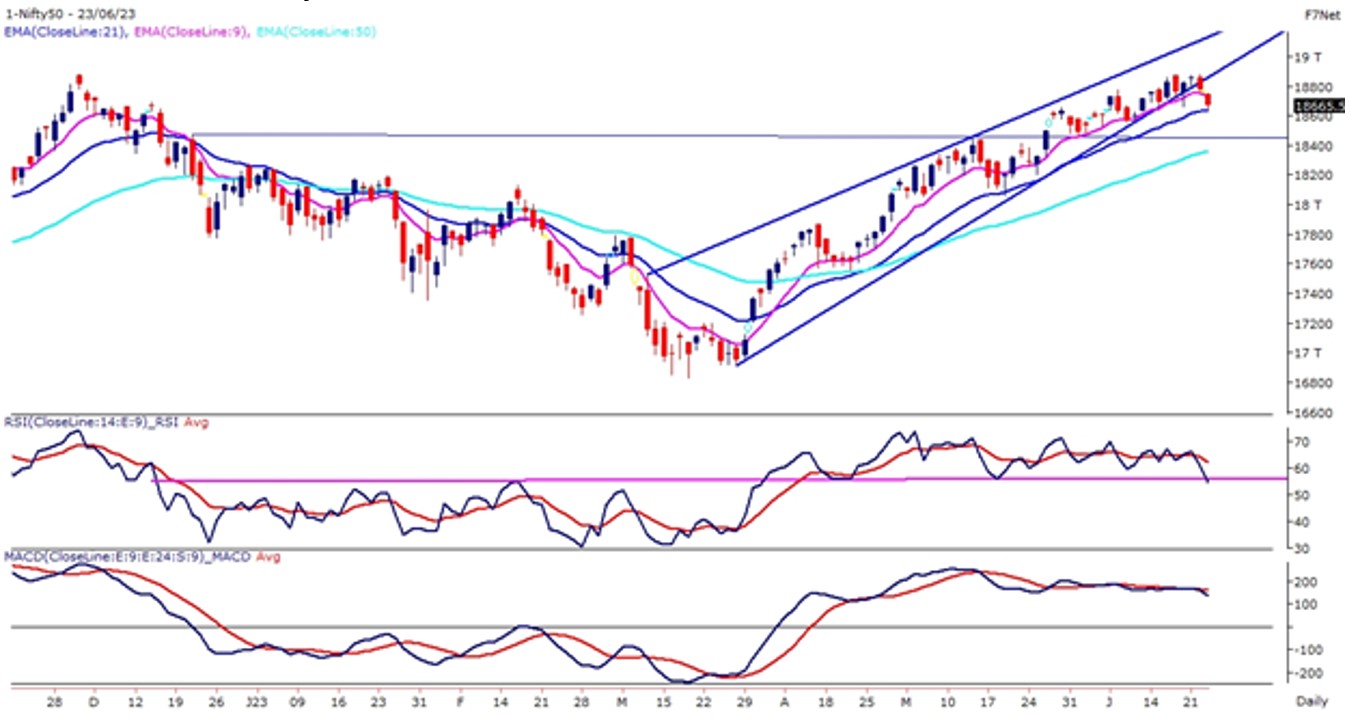
Nifty hope of reaching an all-time high was shattered temperately during the last trading day of the week and the index closed below its 9–day exponential moving average which is placed at 18,735 levels. The benchmark index finally witnessed a breakdown of a rising wedge pattern and closed below the lower band of the pattern on the daily time frame. Moreover, the index has also formed a bearish dark cloud cover candle stick pattern on the weekly scale. On the lower panel, the momentum oscillator RSI (14) is swiftly making an attempt to breach its horizontal trend line support which is placed at 56 levels. As the Nifty drifted lower from the higher levels we witnessed a significant increase in the CE sellers at 18,800, 18,900 & 19,000 levels. Technically the view for the short term has turned negative as we have observed multiple bearish patterns. For bulls, 18,850-18,900 would act as immediate resistance zones, while 18,555-18,500 would act as key support zones. | ||||||||||||||||||||||||||
Technical Overview – Bank Nifty | ||||||||||||||||||||||||||
 |
||||||||||||||||||||||||||
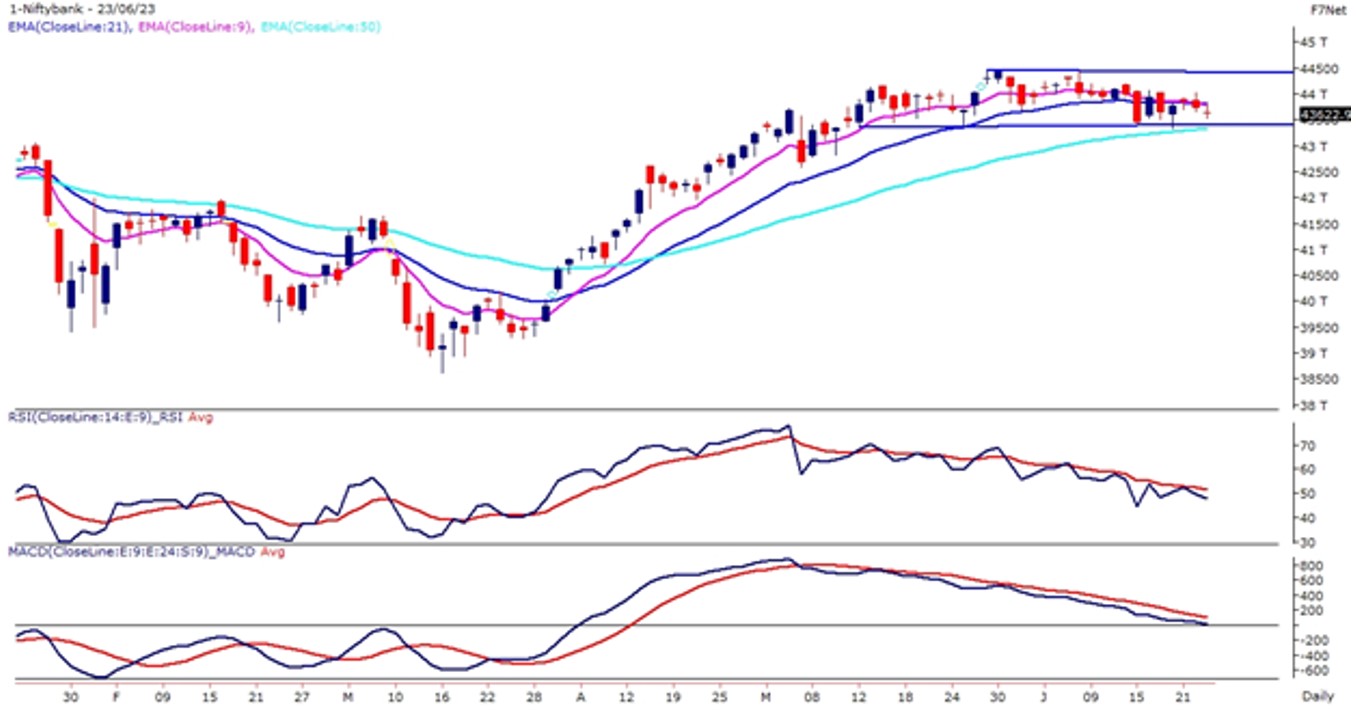
For the past couple of weeks, Bank Nifty has been trading within the rectangle pattern with a bandwidth of 1000 points which clearly indicates a range-bound movement for the index. The daily strength indicator RSI and MACD have both turned neutral and are sustaining near their respective reference lines. The Bank Nifty continues to hold above its 50–day exponential moving average which is placed at 43,322 levels. From the past four trading weeks, the range for the banking index has squeezed which suggests a shape move on either side cannot be ruled out. Bank Nifty stands at strong support in the lower band of the rectangle pattern on the daily chart. If prices fail to hold at 43,300 then it’s likely to see a breakdown of a pattern toward 43,000 – 42,800 levels, and the upper band of the index is capped at 44,100 – 44,400 levels. | ||||||||||||||||||||||||||
Indian markets
| ||||||||||||||||||||||||||
Global Markets
| ||||||||||||||||||||||||||
Stocks in Spotlight
| ||||||||||||||||||||||||||
Read More- Top Stocks for Equity SIP |
||||||||||||||||||||||||||
News from the IPO world🌐
| ||||||||||||||||||||||||||
Day Leader Board
|
||||||||||||||||||||||||||
Sectoral Performance
| ||||||||||||||||||||||||||
Advance Decline Ratio
| ||||||||||||||||||||||||||
Numbers📈 that matter
|