1. GLENMARK
| Counter | GLENMARK LTP 854 |
| Call | 50% at dip near 807 |
| Target 1 | 1100 |
| Target 2 | 1150 |
| Stop Loss | 645 |
| Time Horizon | 1 Year |
| Notes | — |
Glenmark is focused on developing and marketing branded and generic formulations. Their formulations business spans across various geographies primarily the US, India, Europe, Latin America and Rest of the World. They focus on manufacturing niche products across therapeutic areas of dermatology, respiratory and oncology. They have 14 manufacturing facilities across India, the US, Argentina and Czech Republic. These facilities are inspected by various regulatory bodies, including the US-FDA, MHRA UK, SUKUL-CZ, RU-GMP Russia, TGA Australia, WHO GMP, TPD Canada, MCC South Africa and ANVISA Brazil. Being a research-driven organization, they have also invested in dedicated R&D centers for global markets.
| Previous Close | 855.4 | TTM EPS | 0 |
| 52 Week High | 880.0 | TTM PE | — |
| 52 Week Low | 369.5 | P/B | 2.55 |
| Sector PE | 49.1 | Mkt Cap (Rs. Cr.) | 24,095 |
(Source: Moneycontrol, BSE, Fisdom Research)
Technical Outlook
(Source: Fisdom Research)
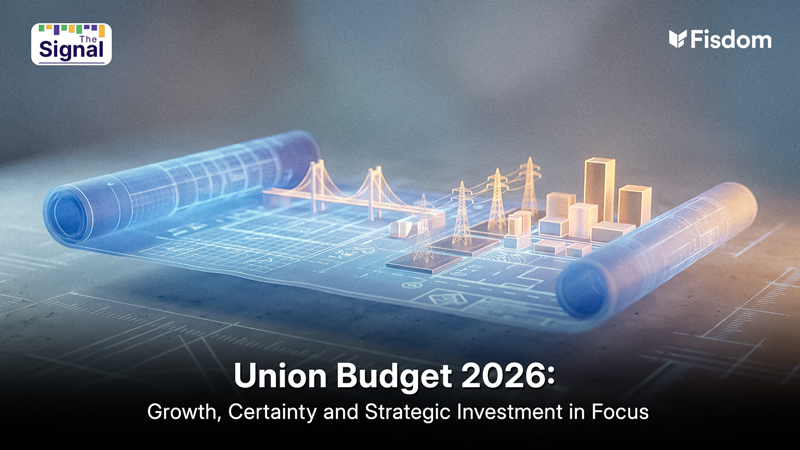
- GLENMARK, on the monthly chart, has been trading in an inverted head and shoulder formation for the past 6 years and has formed base support near 450 – 400 levels.
- The counter has witnessed a multi-year breakout of an inverted head and shoulder pattern. Prices have moved above their neckline resistance, placed at 650 levels.
- The counter is trending above the golden cross on the monthly chart. Technically, the bullish crossover of 21EMA over 50EMA is known as the ‘golden cross’ – the medium to long-term bullish trend. The momentum oscillator RSI (14) has given a trend line breakout above 65 levels with a bullish crossover on the cards.
- Post-breakout prices have retested the neckline levels and are sustaining above the upper band of the pattern.
|
2. ORIENTCEM
| Counter | ORIENTCEM LTP 251 |
| Call | 50% at Dip near 235 |
| Target 1 | 305 |
| Target 2 | 340 |
| Stop Loss | 190 |
| Time Horizon | 1 Year |
| Notes | — |
Orient Cement started commercial production at its integrated cement plant located at Chittapur, Gulbarga, Karnataka. With a total capacity of 8.5 MTPA, they serve Maharashtra, Telangana, Andhra Pradesh, Karnataka and parts of Madhya Pradesh, Tamil Nadu, Kerala, Gujarat and Chhattisgarh. Orient Cement’s products are produced at the technologically advanced manufacturing facilities. With the help of equipment sourced from only the world’s best manufacturers like L&T, CIMMCO, FLSmidth and KHD, the entire cement manufacturing process is monitored & controlled centrally from a state-of-the-art central control room to fine tune and ensure quality output.
| Previous Close | 248.5 | TTM EPS | 7.64 |
| 52 Week High | 262.9 | TTM PE | 32.9 |
| 52 Week Low | 104.6 | P/B | 3.2 |
| Sector PE | 55.45 | Mkt Cap (Rs. Cr.) | 5,144 |
(Source: Moneycontrol, BSE, Fisdom Research)
Technical Outlook
(Source: Fisdom Research)
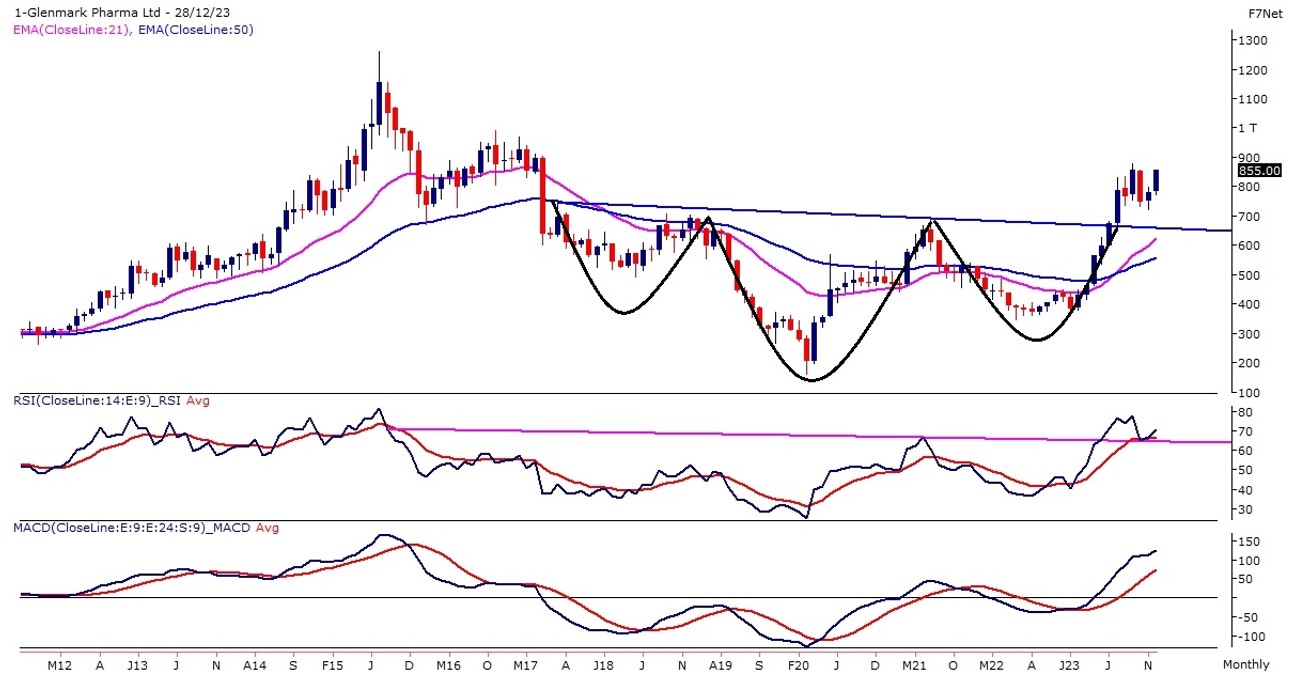
- ORIENTCEM recently exhibited a breakout on its monthly chart, accompanied by a substantial surge in trading volumes. An inverted head and shoulder pattern characterize this breakout, and the stock prices have effectively maintained their position above the neckline of this pattern. This signals a probable extension of the preceding upward trend following a breakout.
- An array of indicators and oscillators about the stock is aligning to suggest an attractive “buy-on-dips” opportunity. These metrics consistently read above the polarity levels and have given a trend line breakout reaffirming the prevailing bullish sentiment.
|
3. L&TFH
| Counter | L&TFH LTP 165 |
| Call | 50% at Dip near 147 |
| Target 1 | 210 |
| Target 2 | 235 |
| Stop Loss | 125 |
| Time Horizon | 1 Year |
| Notes | — |
L&T Finance Holdings Ltd. is one of the leading Non-Banking Financial Companies (NBFCs) in India, with a strong presence across the lending business catering to the diverse financing needs of served and underserved customers. Through its entity L&T Finance Holdings., it offers Personal loans, Two-Wheeler loans, Home loans, Micro loans, Farm loans, and SME loans. At L&T Finance, we are committed to providing customised financial solutions that meet the unique needs of our customers. With a focus on innovation and customer-centricity, we aim to be a trusted partner in our customers’ financial journey.
| Previous Close | 162.2 | TTM EPS | 8.4 |
| 52 Week High | 166.2 | TTM PE | 19.7 |
| 52 Week Low | 78.9 | P/B | 1.9 |
| Sector PE | 30.7 | Mkt Cap (Rs. Cr.) | 41,057 |
(Source: Moneycontrol, BSE, Fisdom Research)
Technical Outlook
(Source: Fisdom Research)
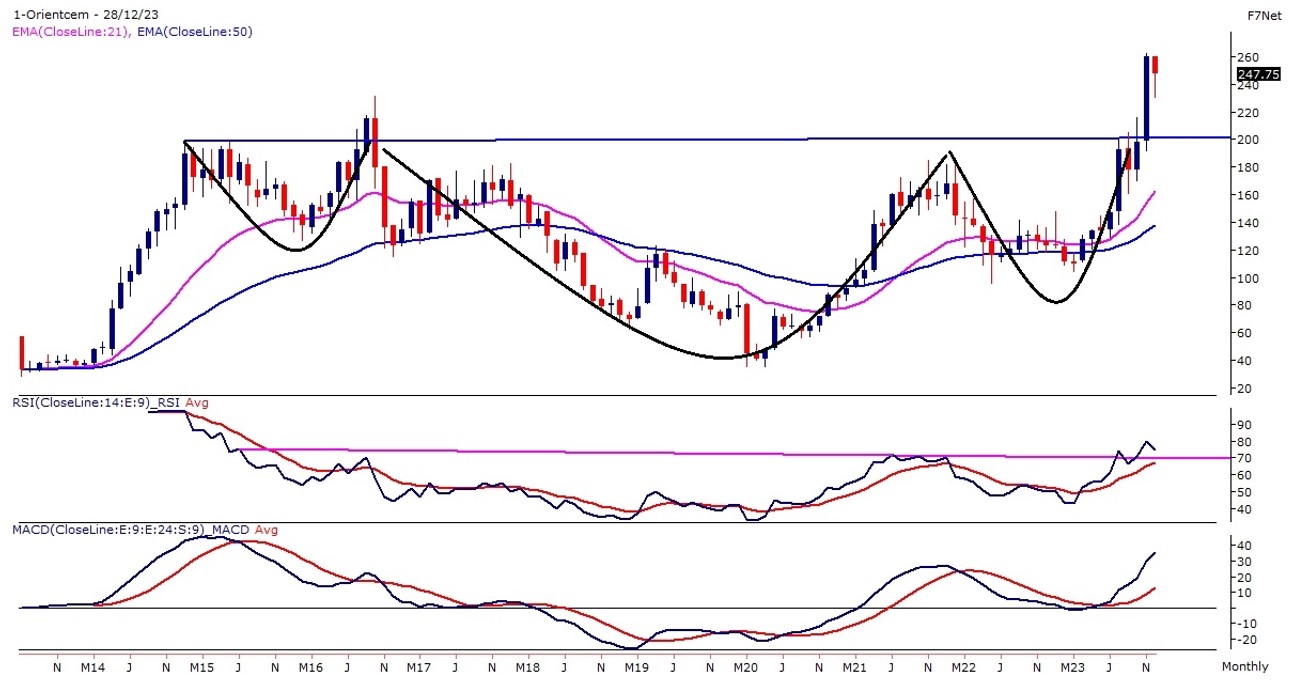
- L&TFH has recently broken out of an ascending triangle pattern with solid volumes on the monthly chart, indicating a bullish trend.
- A golden cross has formed as the 21-month exponential moving average crossed above the 50-month average, and the RSI (14) shows a range pattern breakout above 60 levels with a bullish crossover on the cards.
- The MACD indicator also signals a bullish trend as reading above its polarity line.
|
4. ITC
| Counter | ITC LTP 462 |
| Call | 50% at Dip near 443 |
| Target 1 | 515 |
| Target 2 | 540 |
| Stop Loss | 415 |
| Time Horizon | 1 Year |
| Notes | — |
ITC is one of India’s foremost private sector companies and a diversified conglomerate with businesses spanning Fast Moving Consumer Goods, Hotels, Paperboards and Packaging, Agri Business and Information Technology. The Company is acknowledged as one of India’s most valuable business corporations with a Gross Revenue of ₹ 69,481 crores and Net Profit of ₹ 18,753.31 crores (as on 31.03.2023). ITC was ranked as India’s most admired company, according to a survey conducted by Fortune India, in association with Hay Group.
| Previous Close | 464.1 | TTM EPS | 16.2 |
| 52 Week High | 499.7 | TTM PE | 28.6 |
| 52 Week Low | 326.0 | P/B | 8.3 |
| Sector PE | 30.6 | Mkt Cap (Rs. Cr.) | 576,497 |
(Source: Moneycontrol, BSE, Fisdom Research)
Technical Outlook
(Source: Fisdom Research)
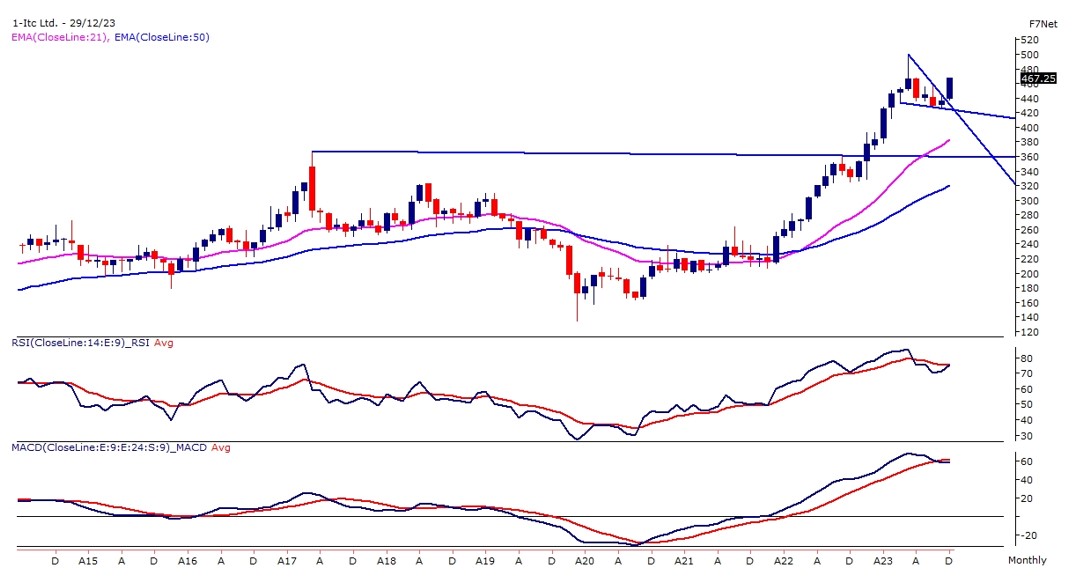
- ITC, on the broader time frame, is trading in a higher high or low formation and consistently sustaining above its medium and long-term averages. ITC has witnessed a bullish flag pattern breakout on the monthly chart after a time-wise correction.
- The momentum oscillator RSI (14) on the lower panel reads in a higher, higher, and lower formation and in a bullish range shift zone. The MACD indicator is reading above its line of polarity.
- The counter has given a rectangle pattern breakout on the weekly chart, confirming a double price breakout.
|
5. IRCTC
| Counter | IRCTC LTP 887.5 |
| Call | 50% at Dip near 820 |
| Target 1 | 1000 |
| Target 2 | 1100 |
| Stop Loss | 720 |
| Time Horizon | 1 Year |
| Notes | — |
Indian Railway Catering and Tourism Corporation Ltd. (IRCTC) is a “Mini Ratna (Category-I)” Central Public Sector Enterprise under Ministry of Railways, Government of India. IRCTC was incorporated on 27th September, 1999 as an extended arm of the Indian Railways to upgrade, professionalize and manage the catering and hospitality services at stations, on trains and other locations and to promote domestic and international tourism through development of budget hotels, special tour packages, information & commercial publicity and global reservation systems. The authorized capital of the company is 250 crores and paid up capital is 160 crores. It’s registered and Corporate Office is situated at New Delhi.
| Previous Close | 864.2 | TTM EPS | 13.3 |
| 52 Week High | 916.5 | TTM PE | 66.9 |
| 52 Week Low | 557.1 | P/B | 28.7 |
| Sector PE | 65.3 | Mkt Cap (Rs. Cr.) | 71,000 |
(Source: Moneycontrol, BSE, Fisdom Research)
Technical Outlook
(Source: Fisdom Research)
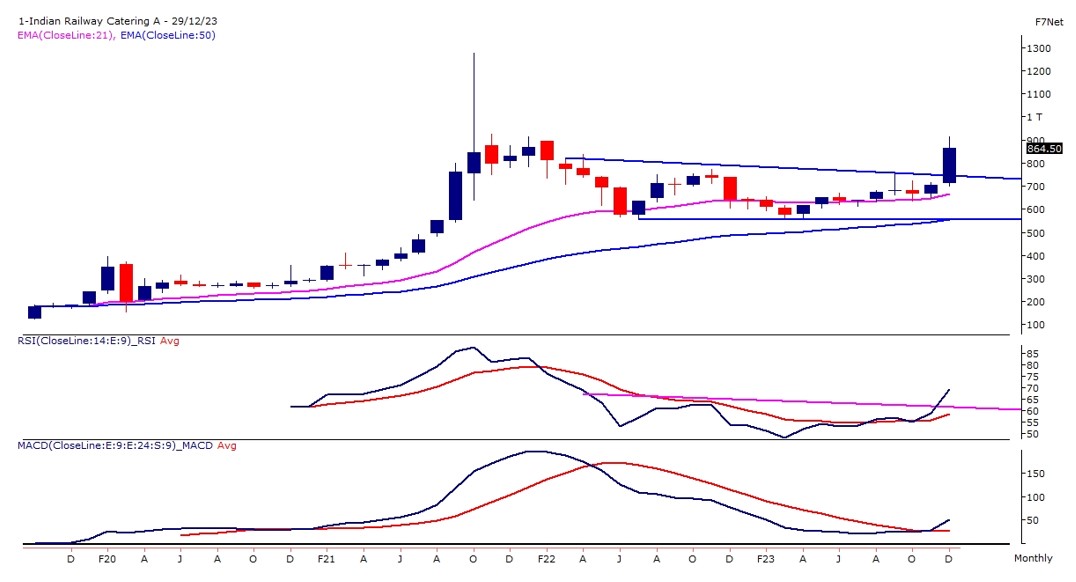
- IRCTC, on the monthly chart, has witnessed a rectangle pattern breakout, and prices are trading above the upper band of the range.
- The stock has given a range pattern breakout on the weekly time frame, further confirming the longer-term trend.
- Stock is trading above its 21, 50, and 100–week exponential moving average, which adds strength to the current momentum.
- The momentum oscillator RSI (14) has given a trend line breakout above 60 levels, then reads higher with a bullish crossover. The MACD indicator is reading above its polarity line with a positive crossover.
|
Disclaimer: This document is not intended for anyone other than the recipient. The contents of this document may not be reproduced or further distributed to any person or entity, whether in whole or in part, for any purpose. If you have received the publication in error please notify the sender immediately. If you are not the named addressee, you should not disseminate, distribute or copy this document. You are hereby notified that disclosing, copying, distributing or taking any action in reliance on the contents of this information is strictly prohibited. All non-authorised reproduction or use of this document will be the responsibility of the user and may lead to legal proceedings. This document has no contractual value and is not and should not be construed as advice or as an offer or the solicitation of an offer or a recommendation to take action in consonance in any jurisdiction. Finwizard Technology Private Limited (“Fisdom”) makes no guarantee, representation or warranty and accepts no responsibility or liability for the accuracy or completeness of the information and/or opinions contained in this document, including any third party information obtained from sources it believes to be reliable but which has not been independently verified. In no event will Fisdom be liable for any damages, losses or liabilities including without limitation, direct or indirect, special, incidental, consequential damages, losses or liabilities, in connection with your use of this document or your reliance on or use or inability to use the information contained in this document, even if you advise us of the possibility of such damages, losses or expenses. Fisdom does not undertake any obligation to issue any further publications or update the contents of this document. The information stated and/or opinion(s) expressed herein are expressed solely as general commentary for general information purposes only and do not constitute advice, solicitation or recommendation to act upon thereof. Fisdom does not have regard to specific investment objectives, financial situation and the particular needs of any specific person who may receive this document. The information contained within this document has not been reviewed in the light of your personal circumstances. Please note that this information is neither intended to aid in decision making for legal, financial or other consulting questions, nor should it be the basis of any investment or other decisions. Fisdom may have issued other similar documents that are inconsistent with and reach different conclusion from the information presented in this document. The relevant offering documents should be read for further details. You should make such researches/inspections/inquiries as it deems necessary to arrive at an independent evaluation of companies referred to in this document (including the merits and risks involved), and should consult its own advisors to determine the merits and risks involved. Fisdom makes no representations that the offerings mentioned in this document are available to persons of any other country or are necessarily suitable for any particular person or appropriate in accordance with their local law. Among other things, this means that the disclosures set forth in this document may not conform to rules of the regulatory bodies of any other country and investment in the offer discussed will not afford the protection offered by the local regulatory regime in any other country. Past performance contained in this document is not a reliable indicator of future performance whilst any forecasts, projections and simulations contained herein should not be relied upon as an indication of future results. The historical performance presented in this document is not indicative of and should not be construed as being indicative of or otherwise used as a proxy for future or specific investments. The relevant product documents should be read for further details. Fisdom does not undertake any obligation to issue any further publications to you or update the contents of this document and such contents are subject to changes at anytime.