


|
||||||||||||||||||||||||||
The Markets Today in a nutshell | ||||||||||||||||||||||||||
| ||||||||||||||||||||||||||
Technical Overview – Nifty 50 | ||||||||||||||||||||||||||
 |
||||||||||||||||||||||||||
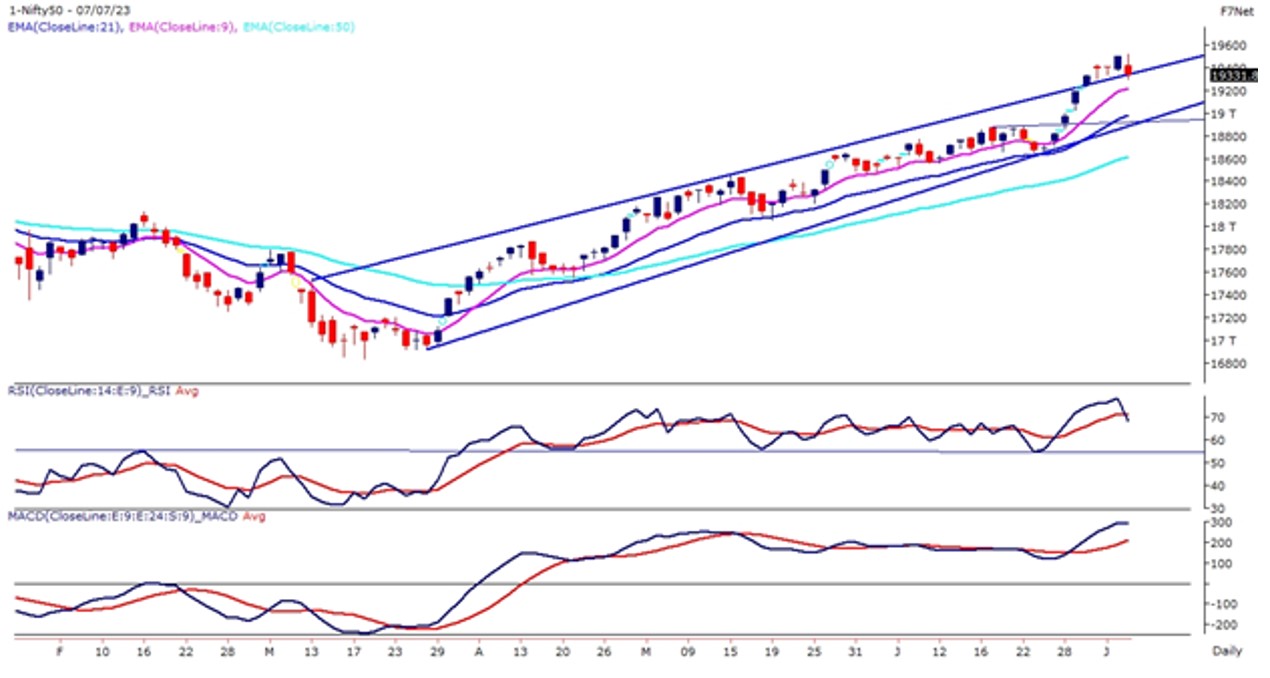
After scaling a fresh all-time-high at 19524, the benchmark Nifty slipped hard and drifted more than 150 points, and closed at 19,331 levels. After registering a life-high Nifty on the weekly chart it formed a bearish shooting star candle stick pattern. For confirmation of the bearish candle stick pattern, we will be requiring a negative closing below the low of the candle on the weekly time frame. Technically the structure of the Benchmark index is very impressive as prices are trading in a higher high higher bottom formation. The momentum oscillator has RSI (14) and has found resistance at 75 levels but still hovering in a bullish range shift zone. For the trend trader now 19,250 would be the sacrosanct support. Above this, the market could rally to 19,450 – 19,500 levels. On the flip side, below 19,250 uptrends may pause for a while. Below the same, we could see a quick correction to 19,100 levels. | ||||||||||||||||||||||||||
Technical Overview – Bank Nifty | ||||||||||||||||||||||||||
 |
||||||||||||||||||||||||||
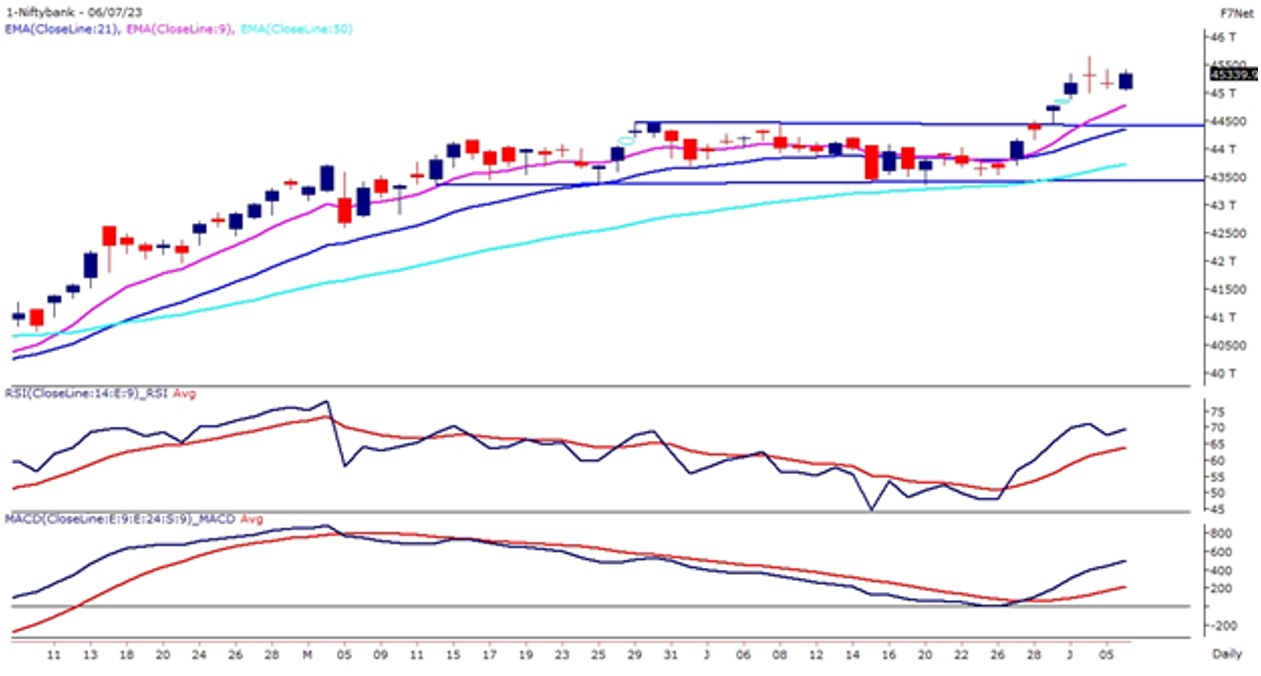
The Banking index on 7th July witnessed a gap down opening following its global peers and drifting more than 400 points and closing below the 45,000 mark. A couple of days back the Banking index formed two consecutive Doji candle stick patterns which hinted bulls are getting tired and there may be a pause in the trend. After registering a life-high Bank Nifty on the weekly chart it formed a bearish gravestone Doji candle stick pattern. For confirmation of the bearish candle stick pattern, we will be requiring a negative closing below the low of the candle on the weekly time frame. Banking Nifty has partially filled the continuation gap formed on 3rd July. For the trend trader now 44,700 would be the sacrosanct support. Above this, the Bank Nifty could rally to 45,400 – 45,650 levels. On the flip side, below 44,700 uptrends may pause for a while. Below the same, we could see a quick correction to 44,400 levels. | ||||||||||||||||||||||||||
Indian markets
| ||||||||||||||||||||||||||
Global Markets
| ||||||||||||||||||||||||||
Stocks in Spotlight
| ||||||||||||||||||||||||||
News from the IPO world🌐
| ||||||||||||||||||||||||||
Day Leader Board
|
||||||||||||||||||||||||||
Sectoral Performance
| ||||||||||||||||||||||||||
Advance Decline Ratio
| ||||||||||||||||||||||||||
Numbers📈 that matter
| ||||||||||||||||||||||||||