

|
||||||||||||||||||||||||||
| ||||||||||||||||||||||||||
Technical Overview – Nifty 50 | ||||||||||||||||||||||||||
| ||||||||||||||||||||||||||
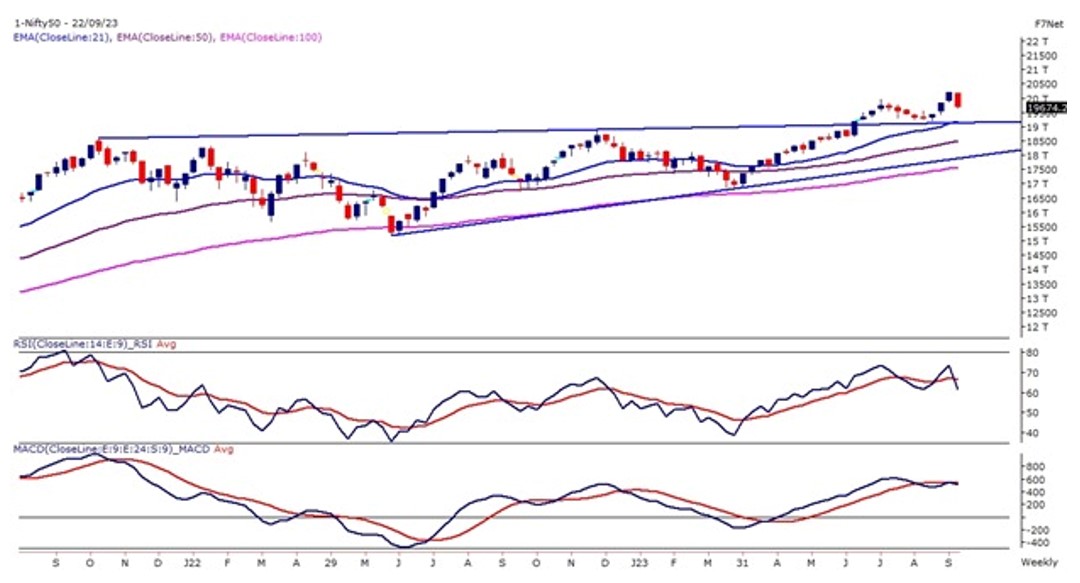
The Nifty index closed below the 20-day EMA (exponential moving average – 19,780), signaling a diminishing bullish sentiment. The selling pressure continues after the back-to-back gap-down moves, with the Nifty50 falling in a lower high lower low formation. The Benchmark index on the weekly chart has formed a tall red candle after three consecutive weeks of positive closing. The Index has drifted more than 2.50% in a week indicating a strong throwback towards 19,650 levels. The prices on the daily chart are trading in a broadening triangle pattern and presently have taken resistance at the top and drifted lower. The immediate support is near 19,600 on the downside, a break below 19,600 will trigger further downside till 19,500 levels. Upside a break above 19,850 would add some bullishness. | ||||||||||||||||||||||||||
Technical Overview – Bank Nifty | ||||||||||||||||||||||||||
| ||||||||||||||||||||||||||
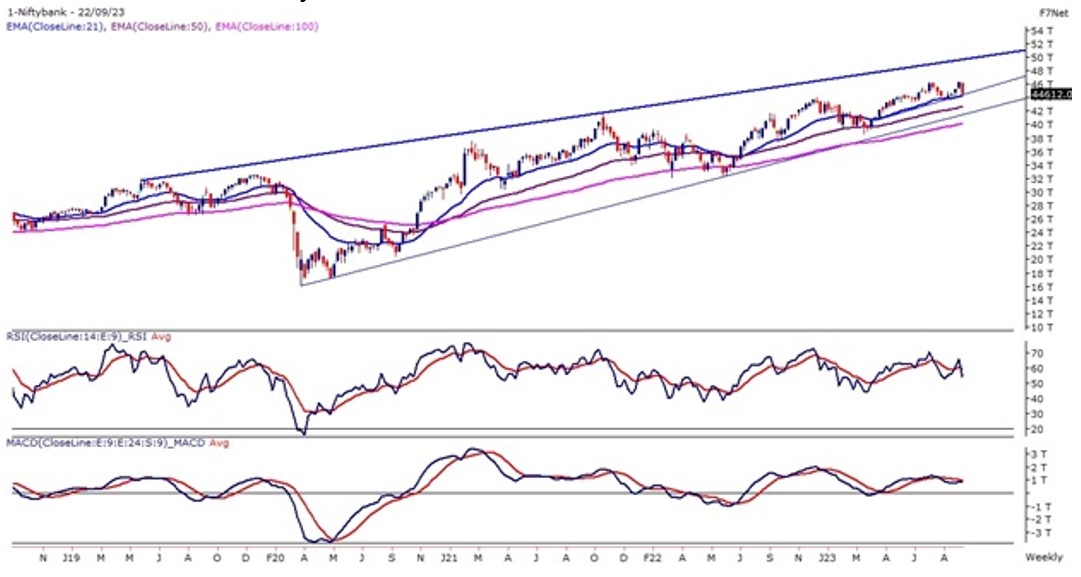
The Bank Nifty on 22nd Sept witnessed a gap-up opening but prices could hold on to the gains and continue to trade with a supper volatile and prices were swinging like a pendulum. The Banking index on the weekly chart has drifted more than 3.45% and has formed a tall red candle indicating selling pressure. The Banking index closed in red for all four days in a week and prices drift below its 9 & 21 EMA on the daily time frame. The momentum oscillator RSI has come down from the overbought zone in the daily chart and drifted 50 levels with a bearish crossover on the cards. The Index has formed a double top formation on the daily chart and prices have closed below the pivot point of the pattern. The broader markets also continued to correct further, with the Nifty Midcap 100 and Small Cap 100 indices declining 1.69 percent and 2.48 percent respectively, with breadth in favor of bears in the 1:2 ratio. The immediate support is near 44,200 on the downside, a break below 44,200 will trigger further downside till 44,000 levels. Upside a break above 45,200 would add some bullishness. | ||||||||||||||||||||||||||
Indian markets:
| ||||||||||||||||||||||||||
Global Markets
| ||||||||||||||||||||||||||
Stocks in Spotlight
| ||||||||||||||||||||||||||
News from the IPO world🌐
| ||||||||||||||||||||||||||
|
Day Leader Board
| ||||||||||||||||||||||||||
Sectoral Performance
| ||||||||||||||||||||||||||
Advance Decline Ratio
| ||||||||||||||||||||||||||
Numbers to track
| ||||||||||||||||||||||||||
|
Please visit www.fisdom.com for a standard disclaimer. |