

|
||||||||||||||||||||||||||
| ||||||||||||||||||||||||||
Technical Overview – Nifty 50 | ||||||||||||||||||||||||||
| ||||||||||||||||||||||||||
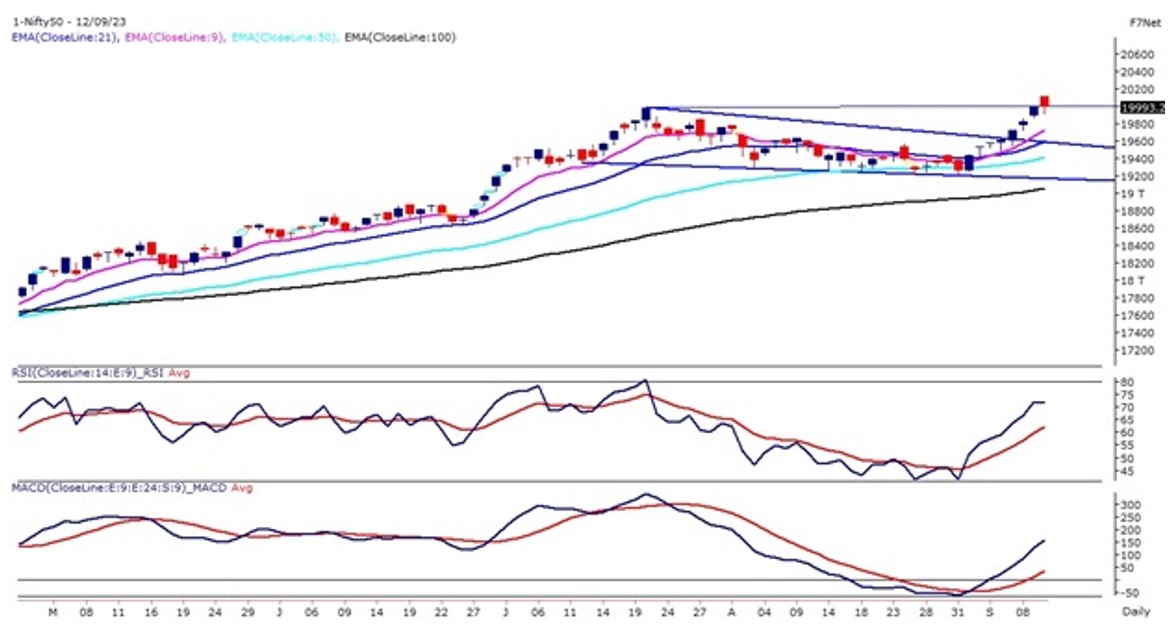
The Nifty50 on 12th Sept witnessed a gap-up opening and recorded a new lifetime high at 20,110 levels on the opening trade and post that without wasting a minute a sharp profit booking was witnessed and the index drifted lower and closed near 20,000 levels by forming a red candle on the daily chart. Focus is shifted towards large stocks as heavy-weighted stocks like Larsen, TCS, Infy, ITC, Ultratech, and Icici bank were taking support today. Heavy selling is witnessed in the small and midcaps today and the breadth of the market deteriorated significantly in today’s session. Market Breadth was strongly indicating a seller’s dominance in the market. The index on the daily chart has taken support near the horizontal trend line and is trading above its falling channel pattern. The momentum oscillator RSI (14) has rebounded sharply from the 40 levels and presently closed at 70 levels with a bullish crossover. The MACD indicator has shifted higher above its line of polarity with a bullish crossover. | ||||||||||||||||||||||||||
Technical Overview – Bank Nifty | ||||||||||||||||||||||||||
| ||||||||||||||||||||||||||
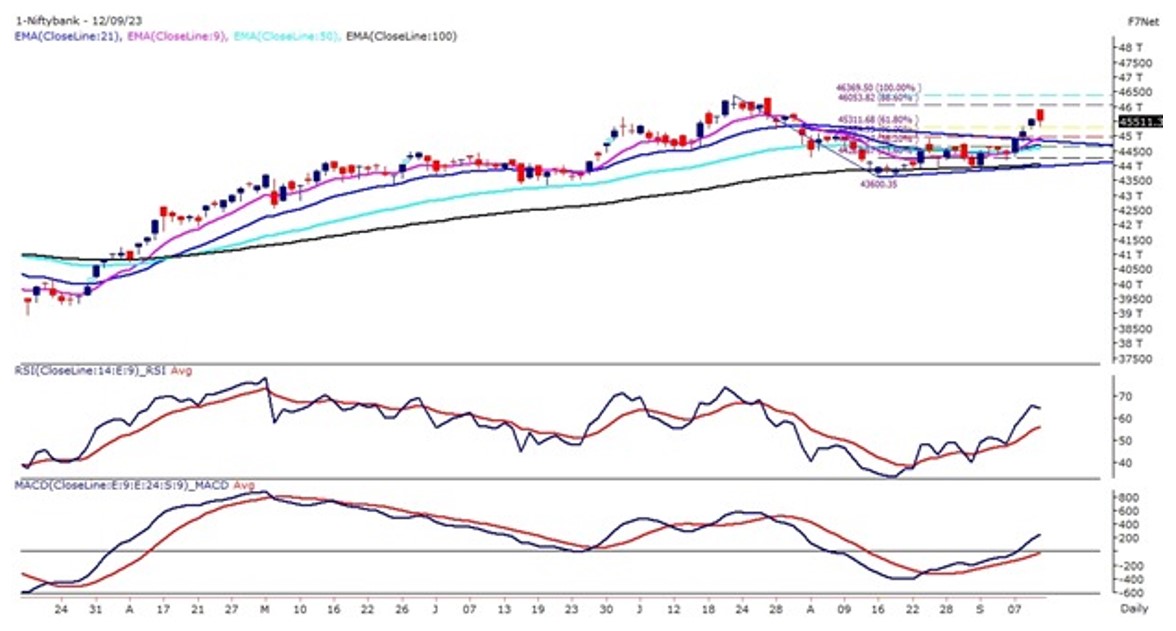
The Banking on 12th Sept witnessed a strong gap-up opening but wouldn’t capitalize on its gains and drifted lower within the first initial minutes of the trade and closed marginally lower than its previous day’s close and formed a red candle for the day. The major selling was witnessed in Nifty Midcap and small-cap for 3 & 4 percent respectively and both the indexes formed a bearish engulfing candle stick pattern on the daily time frame. The India VIX closed 3% higher at 11.69 levels. The broader trend for the Banking index remains bullish as prices are trading in a higher high higher bottom formation. The momentum oscillator RSI (14) is steady above 60 levels with a bullish crossover. The MACD indicator has shifted higher above its line of polarity with a bullish crossover. The technical landscape continues to be positive as long as Bank Nifty trades above the 45,000 mark. Technically speaking, immediate bullish targets or resistance are seen at Bank Nifty’s next psychological 46,000 mark. | ||||||||||||||||||||||||||
Indian markets:
| ||||||||||||||||||||||||||
Global Markets
| ||||||||||||||||||||||||||
Stocks in Spotlight
| ||||||||||||||||||||||||||
News from the IPO world🌐
| ||||||||||||||||||||||||||
|
Day Leader Board
| ||||||||||||||||||||||||||
Sectoral Performance
| ||||||||||||||||||||||||||
Advance Decline Ratio
| ||||||||||||||||||||||||||
Numbers to track
| ||||||||||||||||||||||||||
|
Please visit www.fisdom.com for a standard disclaimer. |