
Realty
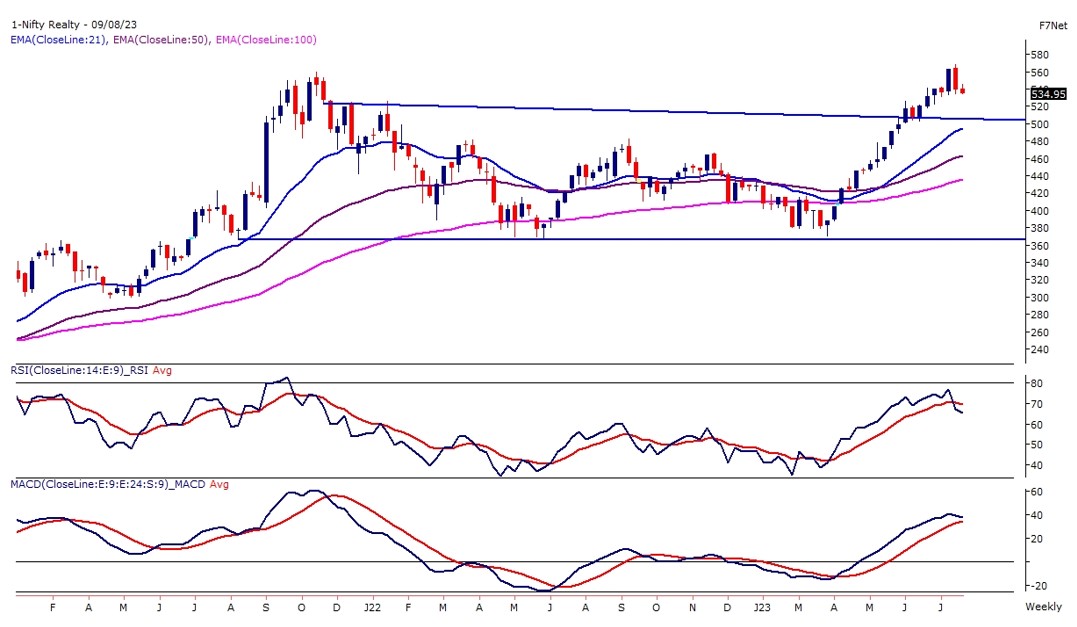
Highlights: INDEX on the weekly chart has witnessed a rectangle pattern breakout
9.0% returns for July 2023
- NIFTY REALTY INDEX on the weekly chart has witnessed a rectangle pattern breakout and post-breakout prices have given a return of almost 9 percent in the past seven weeks. After consecutive bullish candles index has formed a tall red candle on the weekly chart which suggest a possibility of profit booking in the realty stocks.
- The momentum oscillator RSI (14) has reached its overbought zone and drifted lower. The major averages are still trading below the index indicating a constructive uptrend. The broader view remains bullish for the Realty index and any dip near 525 – 515 will be a throwback opportunity to move further higher towards 585 – 600 levels.
FMCG
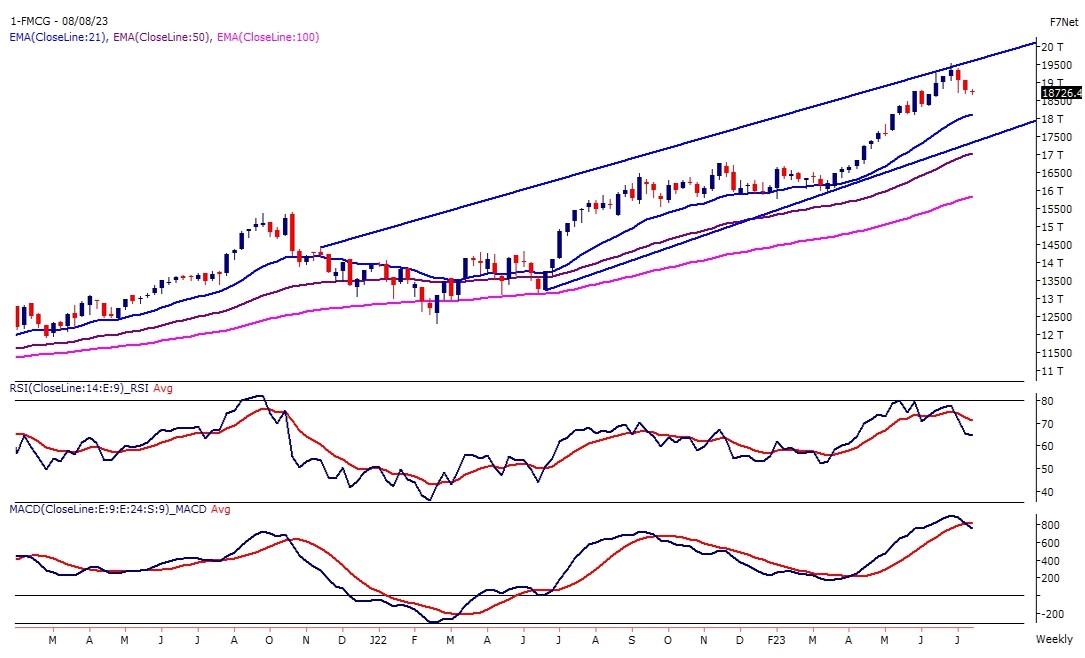
Highlights: Index has taken a resistance near the upper band of the rising channel pattern and has formed a bearish engulfing candle stick pattern
1.6% returns for July 2023
- FMCG Index on the weekly chart is trading in a higher high higher bottom formation within the rising channel pattern. Recently FMCG index has taken a resistance near the upper band of the rising channel pattern and has formed a bearish engulfing candle stick pattern on the weekly time frame.
- On the lower panel momentum, oscillator RSI (14) has formed a bearish divergence near 80 levels which is an overbought zone for an oscillator and drifts lower below 70 levels with a bearish crossover on the weekly scale.
- On the basis of the above technical study, the FMCG index may drift lower to 18,100 levels where 21 EMA is placed and 19,500 will act as an immediate hurdle for the index. A convincing close above 19,500 levels will further extend the bullish stance to 20,000 levels.
Auto
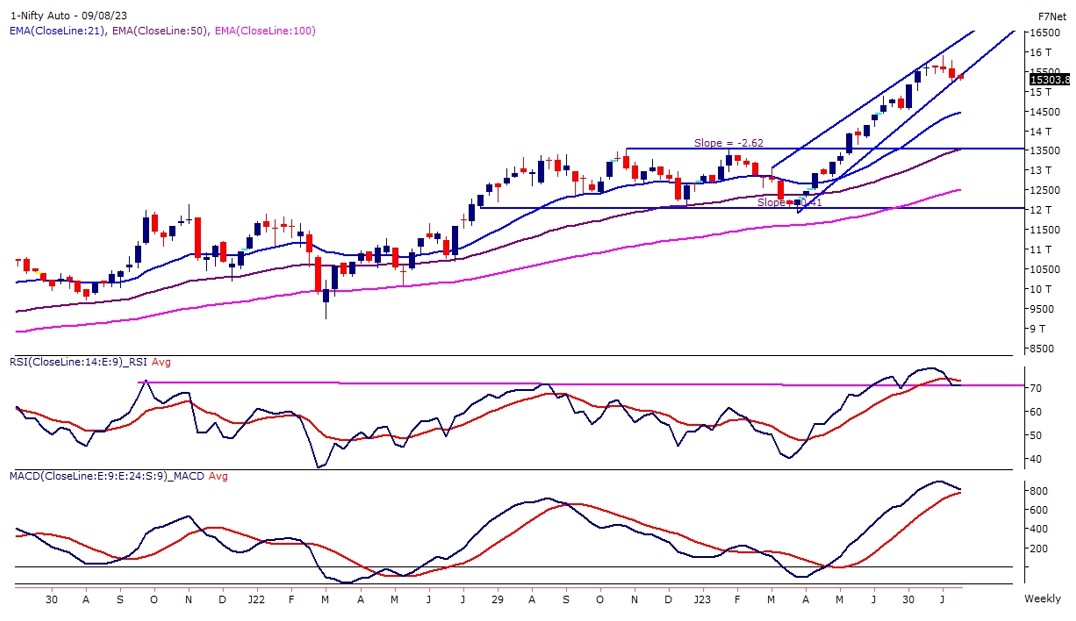
Highlights: The Index continues to trade in a higher high formation without disturbing its long-term bullish trend
3.1% returns for July 2023
- The NIFTY AUTO INDEX has been trading in a very narrow range with high volatility for the past four weeks as candles are forming long wicks on either side. The Index continues to trade in a higher high formation without disturbing its long-term bullish trend.
- The indicators and oscillator have reached the overbought zone, suggesting the Auto index may take a breather. In a bull market stock or an index can remain in an overbought zone for a long time, but timely price retracement cannot be ruled out. Any dip in the Auto Index near 15,000 – 14,700 will be a throwback opportunity to move further higher towards 16,000 – 16,200 levels.
Industrial
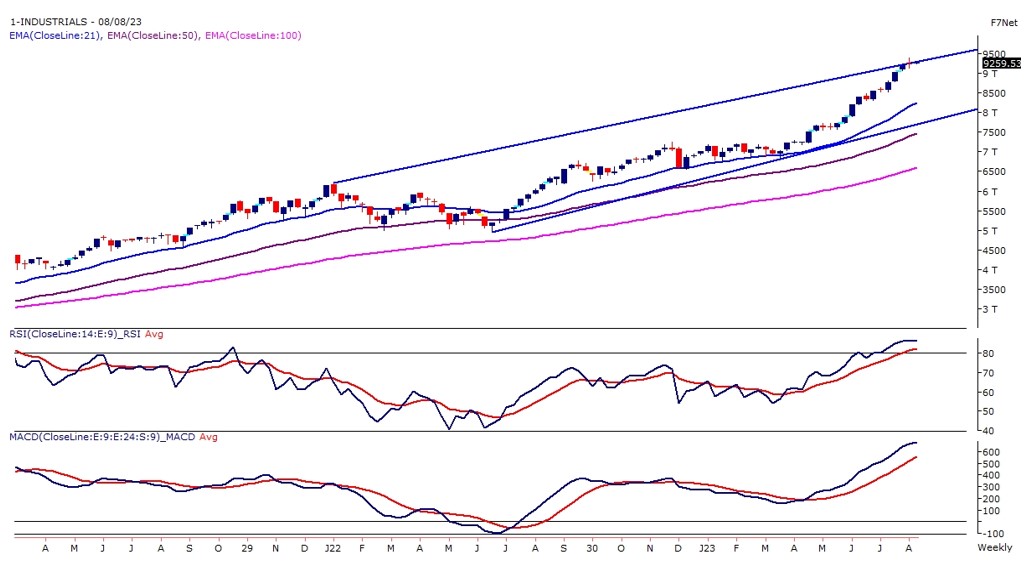
Highlights: The index is trading within the rising channel pattern in a higher high higher bottom formation on the weekly time frame
9.5% returns for July 2023
- The INDUSTRIAL Index trades within the rising channel pattern in a higher high, higher bottom formation on the weekly time frame. The prices have reached near the upper band of the pattern and are likely to find strong resistance at present levels.
- The momentum oscillator RSI (14) is reading near 85 levels, an extremely overbought zone for an oscillator. The distance between the 21-week exponential moving average and prices has increased drastically and in the near-term index may correct a little and come closer towards the average.
- We expect the index to drift lower from here towards 8,700 – 8,500 levels where prices may find an attractive level to go further long in their index. In case prices rejected the correction then the index may trade within the range of 9,500 – 8,900 levels.
Source: BSE, Fisdom Research