
Realty
Highlights: The index on the weekly chart continues to move higher post triangle breakout
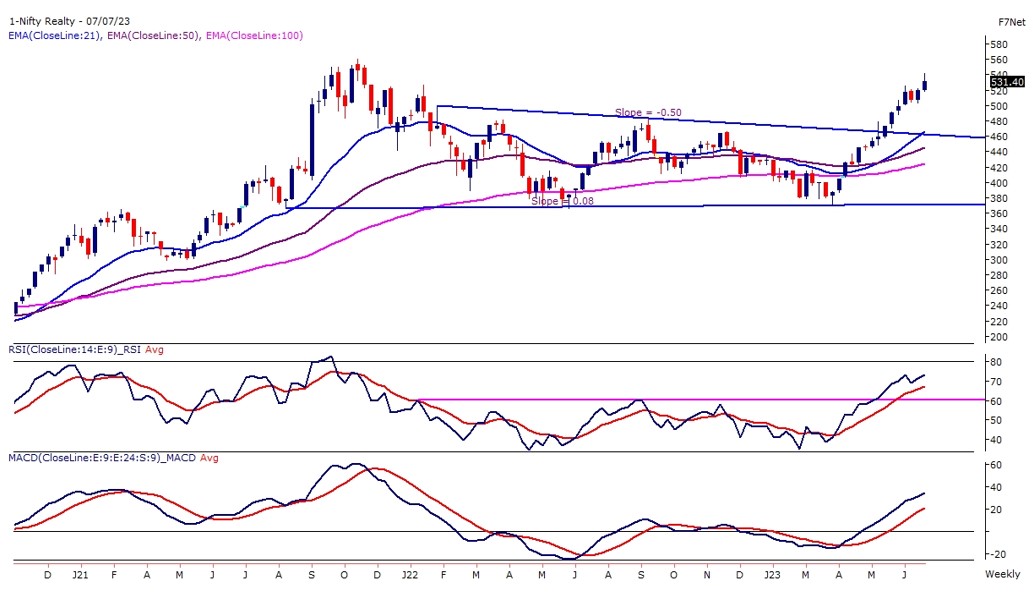
8.6% returns for June 2023
- The Realty Index has shown upward movement on the weekly chart following a breakout from a triangle pattern, and it is maintaining a strong position above its short and medium-term averages. The index has formed a bullish W pattern on the monthly chart, and the momentum oscillator RSI (14) is reading near 70 levels, indicating a bullish crossover.
- With the broader view remaining bullish for the Realty Index, any potential dip near the 490 – 480 level range presents a throwback opportunity for the index to continue its upward trajectory towards 550 – 560 levels.
- Considering these technical factors, investors may find potential buying opportunities within the specified price range as the Realty Index holds a positive outlook.
FMCG
Highlights: Index continued to trade higher post-breakout, further consolidated for a couple of weeks
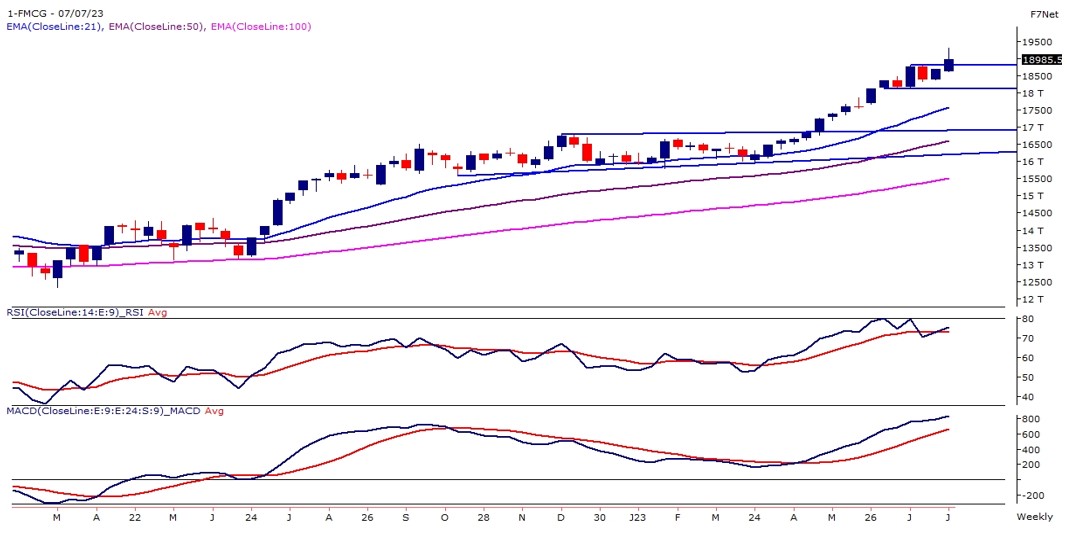
2.4% returns for June 2023
- THE FMCG Index continued to trade higher post-breakout, further consolidated for a couple of weeks, and continued its higher bottom formation on the weekly time frame. The Index has given more than 15% returns in the past 3 months, which clearly indicates strength to the ongoing bullish trend.
- The broader view remains bullish but the momentum oscillator RSI (14) has reached near the overbought zone, hence the spend of the rally may get interrupted. Considering the above factors, a dip towards 18,800 – 18,500 levels will be an opportunity to add again for the higher levels towards 19,700 – 20,000 levels.
Auto
Highlights: The index on the weekly chart continues to trade in a higher high higher low formation, and the index is gaining strong momentum
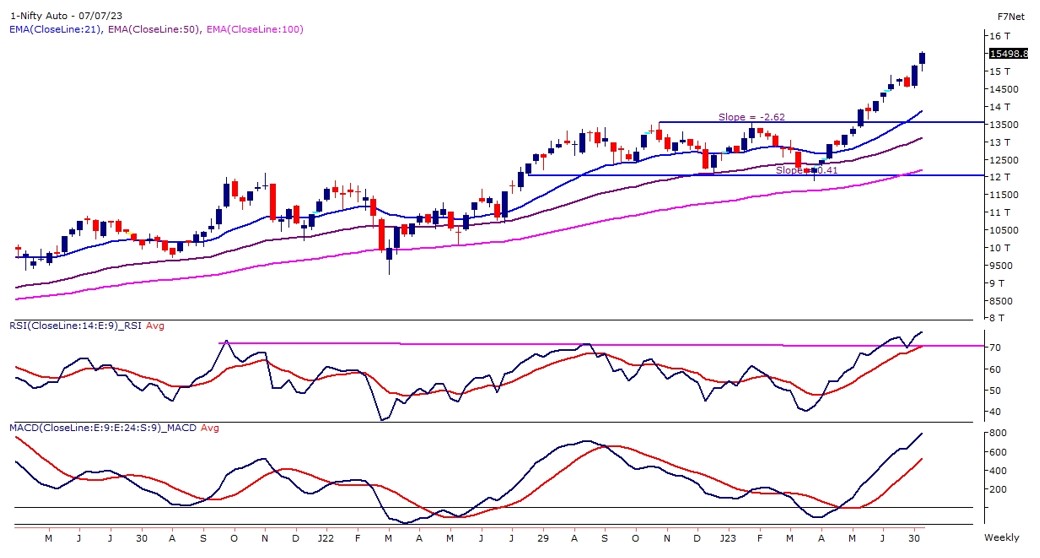
6.7% returns for June 2023
- The Index on the weekly chart continues to exhibit an upward trend, forming higher highs and higher lows. The index has shown strong momentum after breaking out of a rectangle pattern. The recent tall green candle on the weekly chart has engulfed the previous three weeks’ candles, indicating strong bullish sentiment.
- However, it is worth noting that the indicators and oscillators have entered the overbought zone, suggesting a possible pause or correction in the Auto index’s upward movement. In a bull market, an asset or index can remain overbought for an extended period, but it is still possible to see price retracements. If the Auto Index experiences a dip near the 14,500 – 14,300 range, it could present a buying opportunity for a potential move towards higher levels around 15,500 – 15,800.
Industrial
Highlights: Index is trading in a higher high higher bottom formation on the weekly time frame
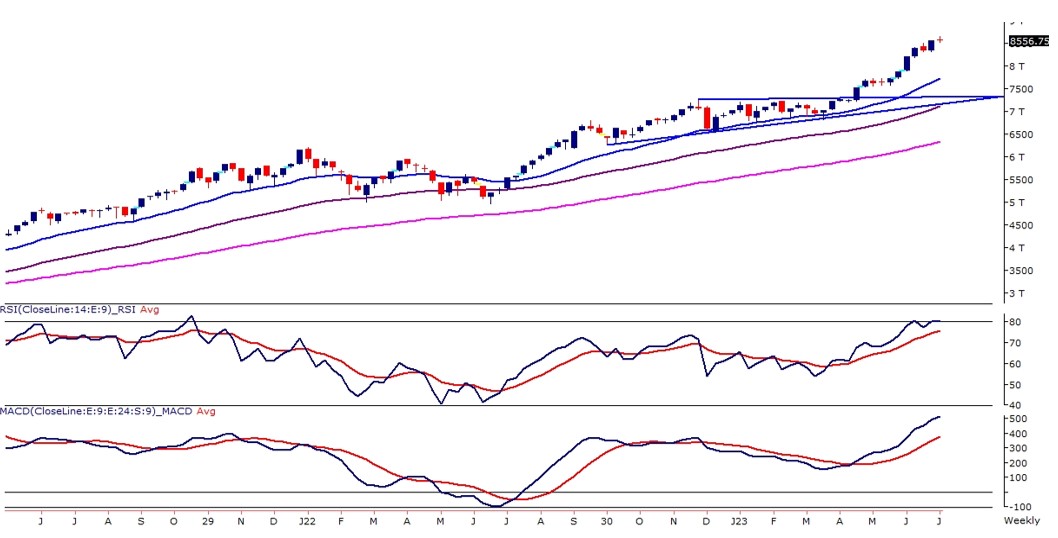
9.8% returns for June 2023
- The industrial index exhibits a higher bottom formation on the weekly time frame, indicating a prevailing bullish sentiment. However, the weekly chart’s momentum oscillator RSI (14) has reached an overbought zone near 80 levels.
- This suggests a potential retracement phase before the index resumes its upward movement. Given these technical factors, a dip towards the 8,150 – 8,000 level range presents an opportunity for long positions, with the expectation of reaching higher levels around 8,750 – 8,800.
Source: BSE, Fisdom Research