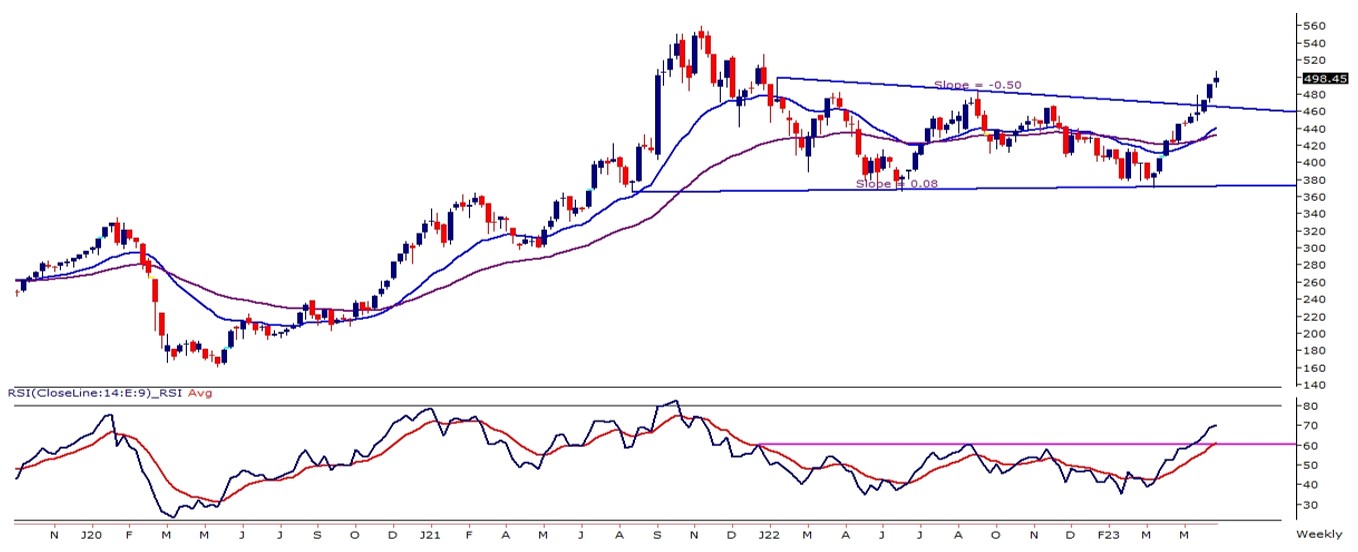
The Nifty Realty index on the weekly chart has experienced a breakout from a triangle pattern and is currently trading above its 21 and 50-day exponential moving averages. Over the last three months, the Nifty Realty index has shown a significant gain of more than 30%, indicating its outperformance compared to the benchmark index.
Despite the solid upward movement, the index has not seen a significant retracement, and some profit booking at current levels is possible. The outlook remains bullish on the broader time frame, with support at 475 levels and resistance around 530 levels.
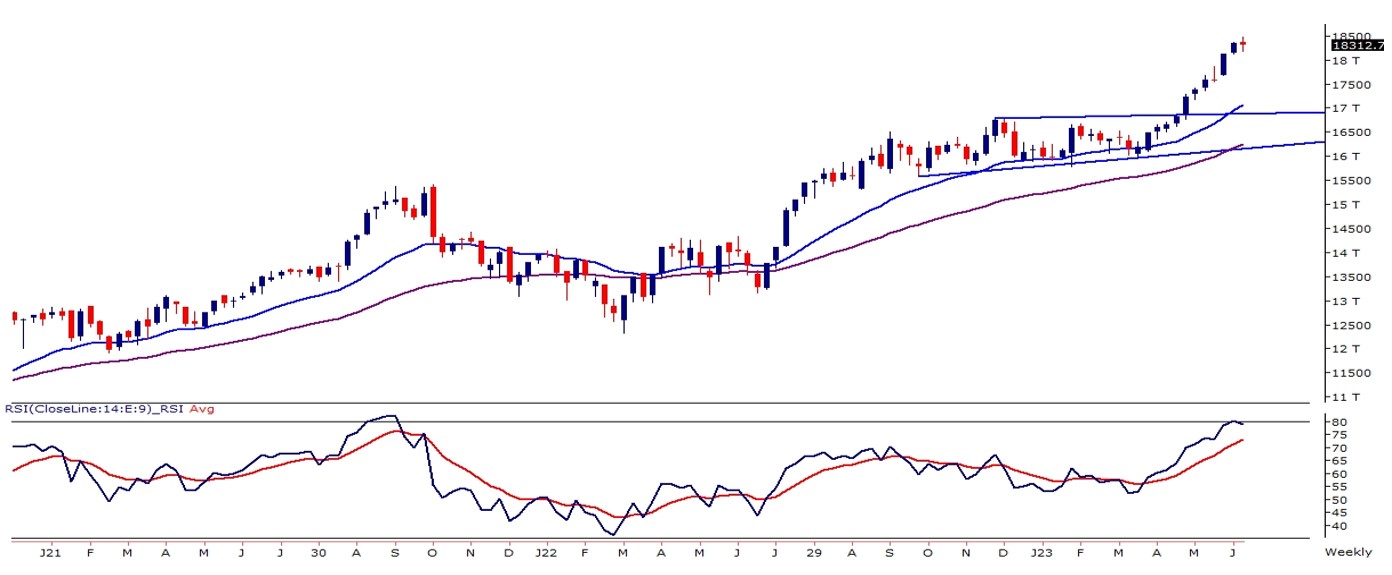
FMCG
On the weekly chart, the FMCG Index has experienced a bullish breakout of a rectangle pattern, resulting in a significant increase of over 8% in the past 7 trading weeks.
Although the index has not seen a substantial retracement in its upward movement, it is possible that profit booking may occur at its current levels. Looking at the broader time frame, the overall outlook remains bullish, with support levels identified at 17,600 – 17,500.
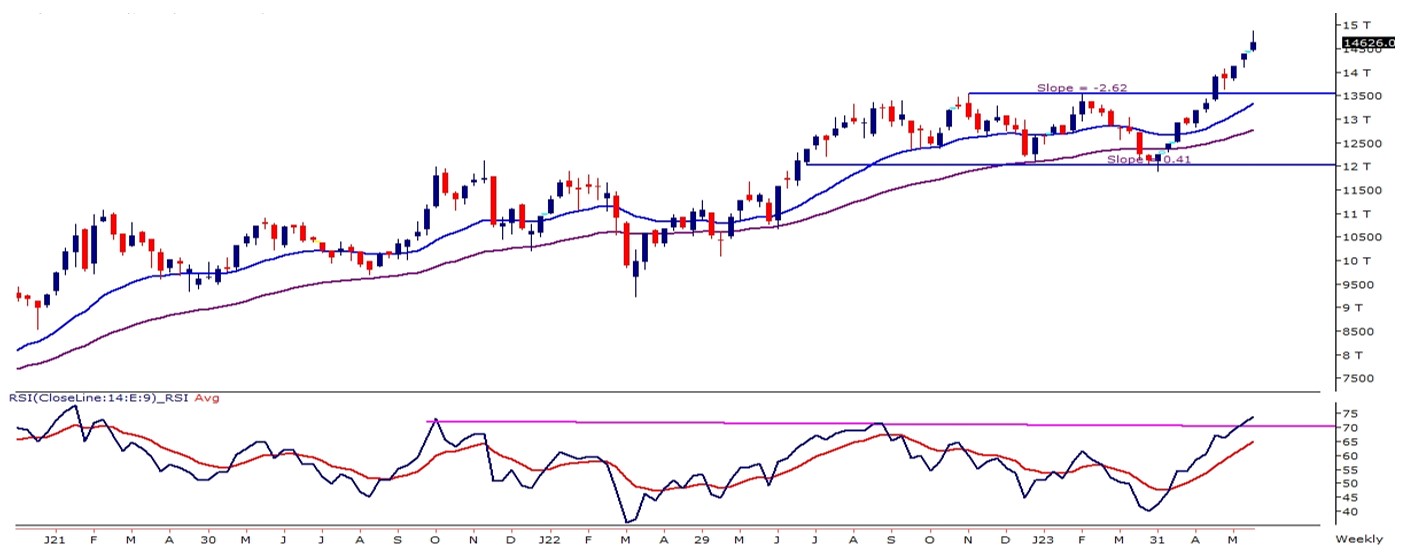
Automobile
On the weekly chart, the Nifty Auto Index has experienced a bullish breakout of a rectangle pattern, resulting in a notable 8% gain over the past five trading weeks. However, caution is advised as the indicators and oscillator have approached the overbought zone, indicating a potential pause in the index’s upward movement.
While the auto index remains in a long-term bullish trend, periodic price retracements are still possible. The outlook remains positive, with support levels around 14,000 – 13,700 expected.
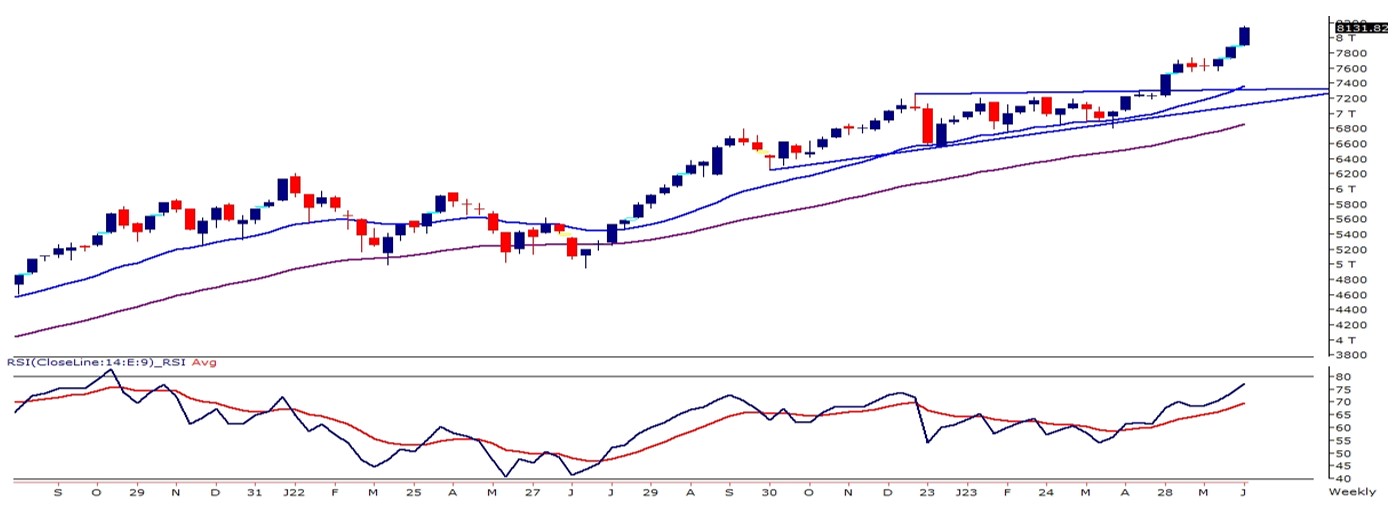
Industrials
The index is currently exhibiting a higher high higher bottom pattern on the weekly time frame, indicating an upward trend. Furthermore, the index has recently experienced a bullish breakout from an ascending triangle pattern, suggesting that the bulls have the upper hand.
However, it’s worth noting that the momentum oscillator RSI (14) on the daily chart has reached a highly overbought level of around 85. This suggests that the index may undergo a retracement phase before resuming its upward movement for the next leg of the higher high, higher bottom pattern.
In terms of support and resistance levels, the index has support at 7,800 – 7,600 levels, while the following resistance levels are expected to be around 8,400 – 8,500.
Download the full report to get the complete coverage