

|
||||||||||||||||||||||||||
| ||||||||||||||||||||||||||
Technical Overview – Nifty 50 | ||||||||||||||||||||||||||
| ||||||||||||||||||||||||||
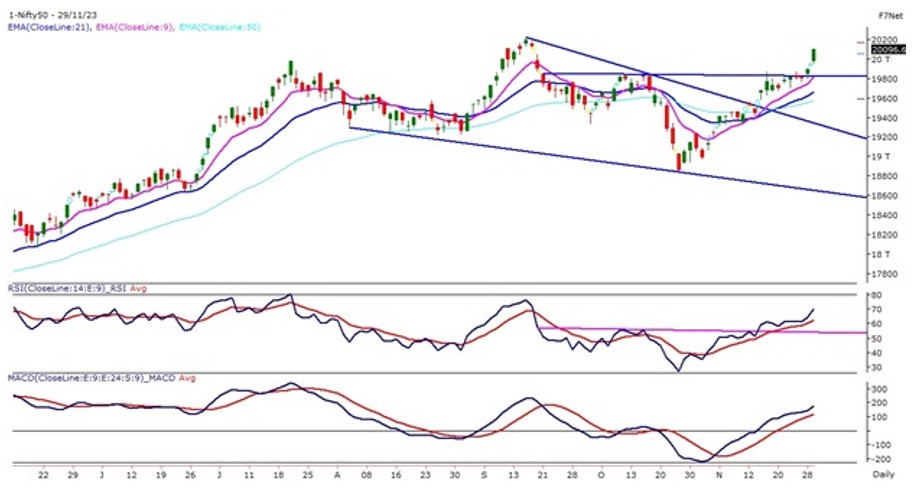
It was a solid bullish day for the Frontline Index where prices have formed a tall green candle on the daily chart. The Benchmark index witnessed a gap-up opening as was indicated by a Gift Nifty and formed a bullish runaway gap on the daily time frame. The Index on the daily chart has also given a horizontal trend line breakout and prices are trading above the range of the breakout. The prices on the daily chart post 26th October, are trading in a higher high higher low formation and constantly trading above their 9 & 21 EMA. The momentum oscillator RSI (14) is reading in a higher high formation post-26th October and has also given a horizontal trend line breakout near 50 levels and moved higher with a bullish crossover. The immediate support for the Index has shifted higher near 19,900 levels as prices have witnessed a range breakout and the immediate resistance is likely to be capped below 20,200 levels. | ||||||||||||||||||||||||||
Technical Overview – Bank Nifty | ||||||||||||||||||||||||||
| ||||||||||||||||||||||||||
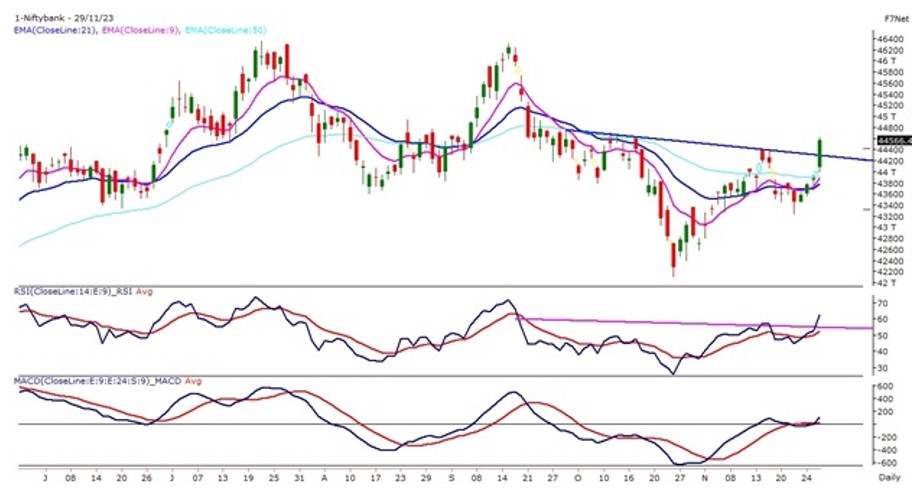
It was a solid bullish day for the Banking Index where prices have formed a tall green candle on the daily chart. The Bank Nifty witnessed a gap-up opening as was indicated by a Gift Nifty and global markets and formed a bullish runaway gap on the daily time frame. The Bank Nifty on the daily chart has witnessed an inverted head & shoulder pattern breakout and the index has closed above the neckline of the pattern. The momentum oscillator RSI (14) is reading in a higher high formation post-26th October and has also given a horizontal trend line breakout near 60 levels and moved higher with a bullish crossover. Presently the Index is trading comfortably above its short and medium-term averages on the daily time frame, which is a positive sign for the index. The immediate support for the Banking Index has shifted higher near 44,200 levels as prices have witnessed a range breakout and the immediate resistance is likely to be capped below 45,400 levels. | ||||||||||||||||||||||||||
Indian markets:
| ||||||||||||||||||||||||||
Global Markets
| ||||||||||||||||||||||||||
Stocks in Spotlight
| ||||||||||||||||||||||||||
News from the IPO world🌐
| ||||||||||||||||||||||||||
|
Day Leader Board
| ||||||||||||||||||||||||||
Sectoral Performance
| ||||||||||||||||||||||||||
Advance Decline Ratio
| ||||||||||||||||||||||||||
Numbers to track
| ||||||||||||||||||||||||||
|
Please visit www.fisdom.com for a standard disclaimer. |