

|
||||||||||||||||||||||||||
| ||||||||||||||||||||||||||
Technical Overview – Nifty 50 | ||||||||||||||||||||||||||
| ||||||||||||||||||||||||||
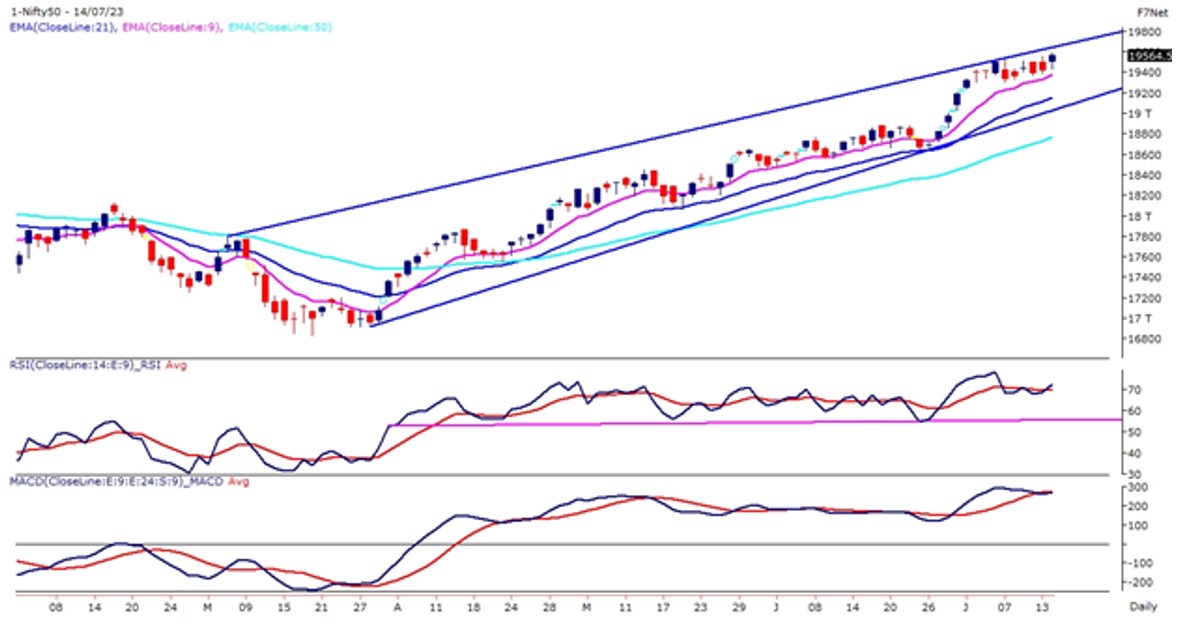
NIFTY50 on 14th July witnessed another gap-up opening duplicating its previous day’s move but this time sustained above 19,450 levels and closed in green indicating a supportive move from the lower levels. On the weekly chart, the Benchmark has witnessed and positive closing for three consecutive weeks and has witnessed a triangle pattern breakout on the weekly time frame. The Nifty50 on the daily chart is trading in a higher high higher bottom formation and continues to trade above its short and medium-term averages. The highest OI on the call side is placed at 19,500 followed by 19,600 and the highest OI on the put side is placed at 19,500 followed by 19,400. Option data seems to be in the favor of bulls and the option chain suggests the same as PCR stands at 1.17. India VIX continues to read within the range of 10 – 12.50 levels suggesting neutral volatility. The last hour of buying has forced Nifty to witness a breakout in the smaller time frame. The immediate support for the Nifty stands near its 9 EMA which is placed at 19,375 levels and the upper band for the index is capped below 19,625 – 19,670 levels. | ||||||||||||||||||||||||||
Technical Overview – Bank Nifty | ||||||||||||||||||||||||||
| ||||||||||||||||||||||||||
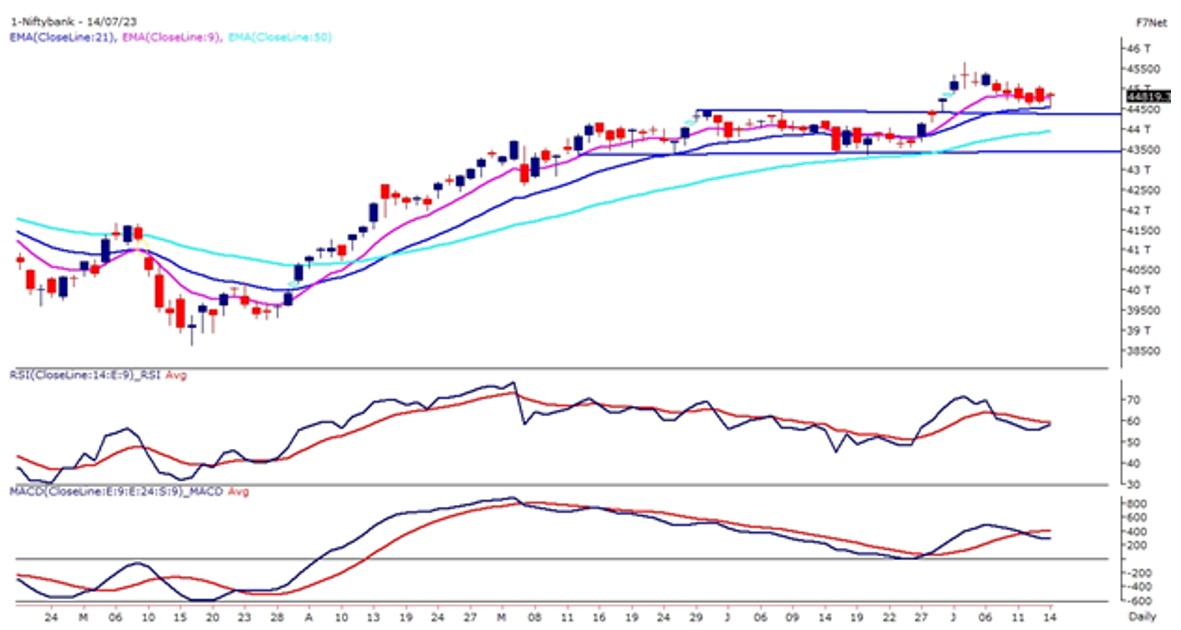
The Bank Nifty on 14th July witnessed a gap-up opening and post that prices continued to trade lower throughout the day but a last-hour buying in the index has pushed banking index above 44,800 levels. The Banking index after a 7-day throwback period has finally formed a bullish hammer candle stick near its trend line support suggesting it can be an immediate bottom for the index. Similarly, the weekly chart index has again formed a Doji candle for consecutive weeks suggesting the volatility in the index. The highest OI on the call side is placed at 45,000 followed by 44,800 and the highest OI on the put side is placed at 44,500 followed by 44,800. Option data still seems to be in the favor of bears and the option chain suggests the same as PCR stands at 0.76. The immediate support for the Bank Nifty stands near its 21 EMA which is placed at 45,500 levels and the upper band for the index is capped below 45,200 – 45,400 levels. | ||||||||||||||||||||||||||
Indian markets:
| ||||||||||||||||||||||||||
Global Markets
| ||||||||||||||||||||||||||
Stocks in Spotlight
| ||||||||||||||||||||||||||
News from the IPO world🌐
| ||||||||||||||||||||||||||
|
Day Leader Board
| ||||||||||||||||||||||||||
Sectoral Performance
| ||||||||||||||||||||||||||
Advance Decline Ratio
| ||||||||||||||||||||||||||
Numbers to track
| ||||||||||||||||||||||||||
|
Please visit www.fisdom.com for a standard disclaimer. |